

Question: Compare Excel Histogram 1 to Excel Histogram 2. View longer description frequency HISTOGRAM - MS EXCEL No reference to class width Compare the Excel
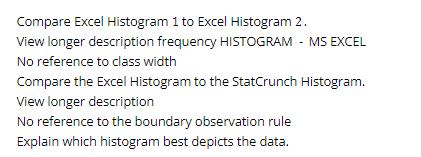
Compare Excel Histogram 1 to Excel Histogram 2. View longer description frequency HISTOGRAM - MS EXCEL No reference to class width Compare the Excel Histogram to the StatCrunch Histogram. View longer description No reference to the boundary observation rule Explain which histogram best depicts the data. FREQUENCY HISTOGRAM - MS EXCEL Descriptive Statistics-Graphically Summarizing Data DATA 9 11 11 11 11 12 13 13 13 13 13 14 14 14 15 15 16 16 16 16 18 18 19 19 20 20 21 35 16 14 12 10 8 6 4 2 0 12 10 8 6 4 2 0 [9, 14.7] Excel Histogram 1 (14.7, 20.4] (20.4, 26.1] Excel Histogram 2 (26.1, 31.8] (31.8, 37.5) [9, 12] (12, 15] (15, 18] (18, 21] (21, 24] (24, 27] (27, 30] (30,33] (33,36] StatCrunch Histogram Options Frequenc 8 B 3 15 Tarl Continue 21 30 33 ** 36
Step by Step Solution
There are 3 Steps involved in it

Get step-by-step solutions from verified subject matter experts