

Question: Compare Plans A, B, and C with their pros and cons. Table B Share performance-Space Technologies Limited 2005 2006 2007 53.91 54.93 56.43 Space Technologies
Compare Plans A, B, and C with their pros and cons.
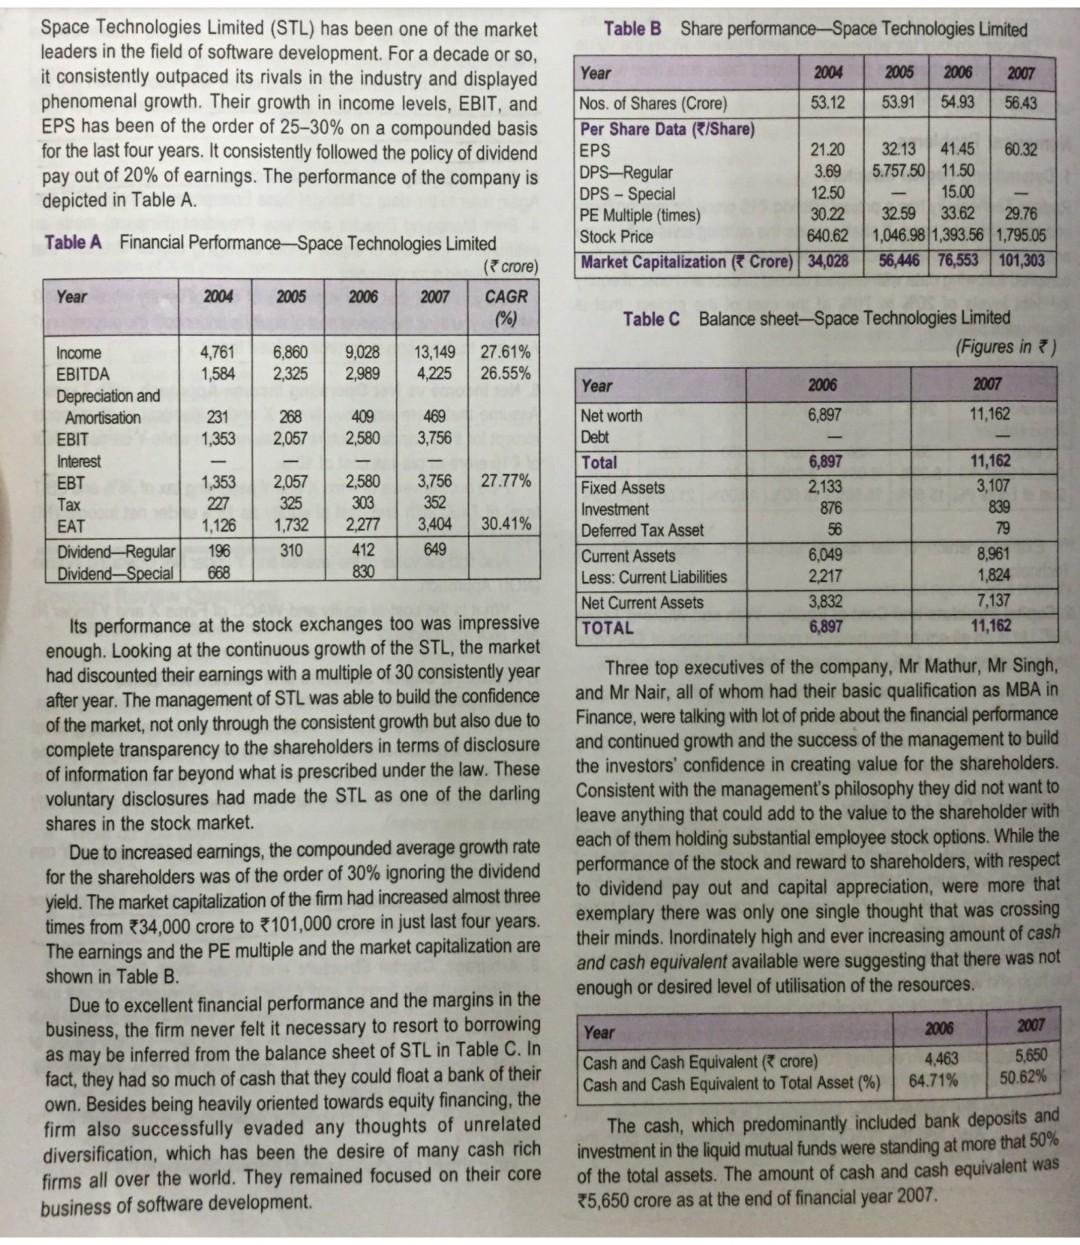
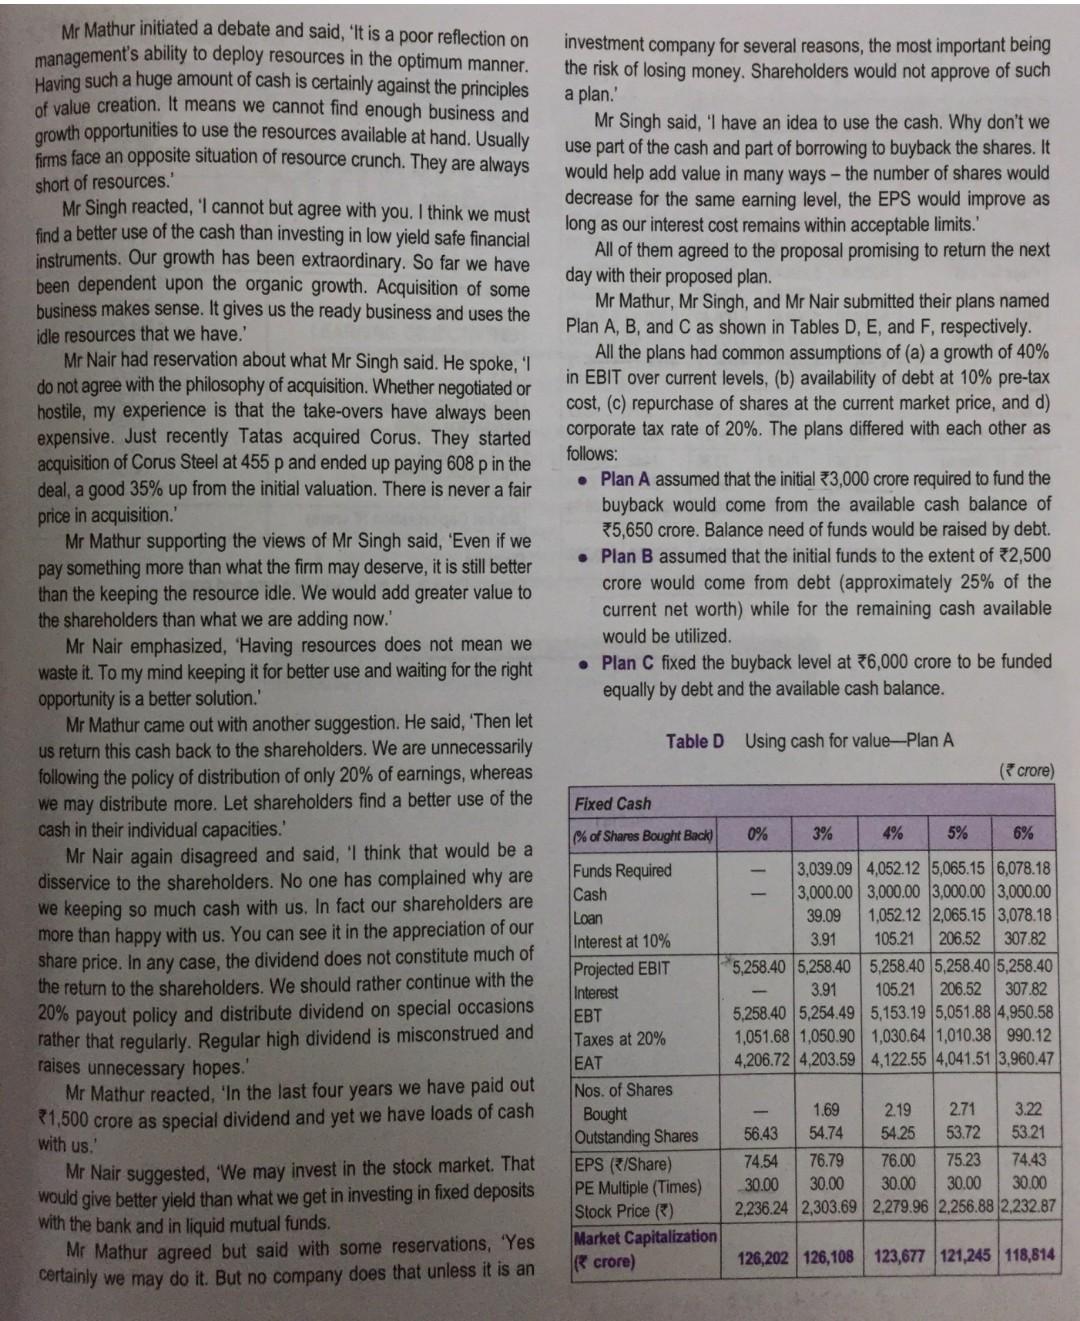
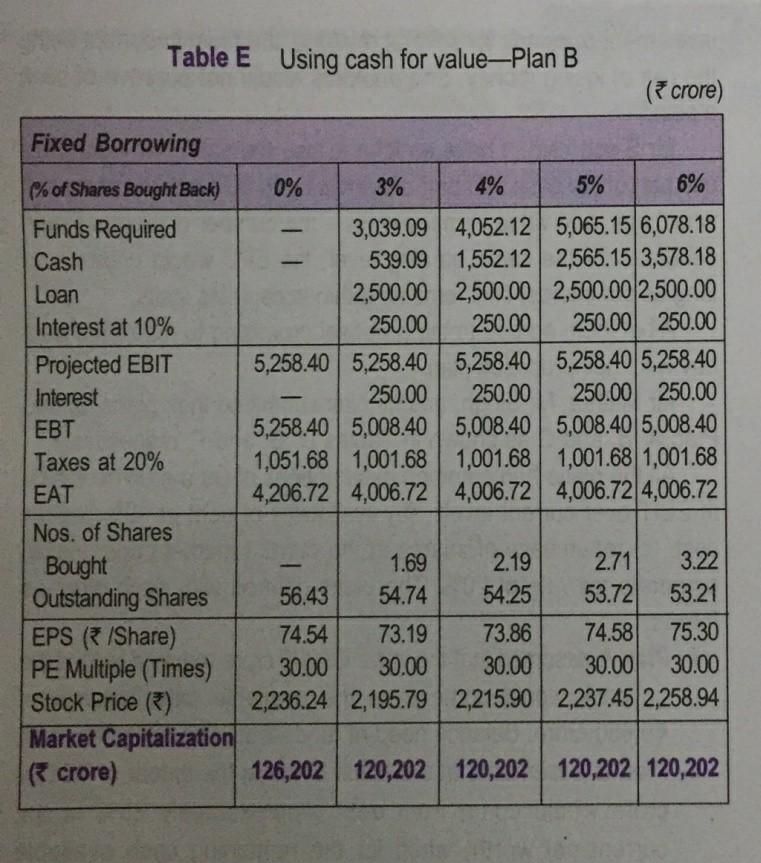
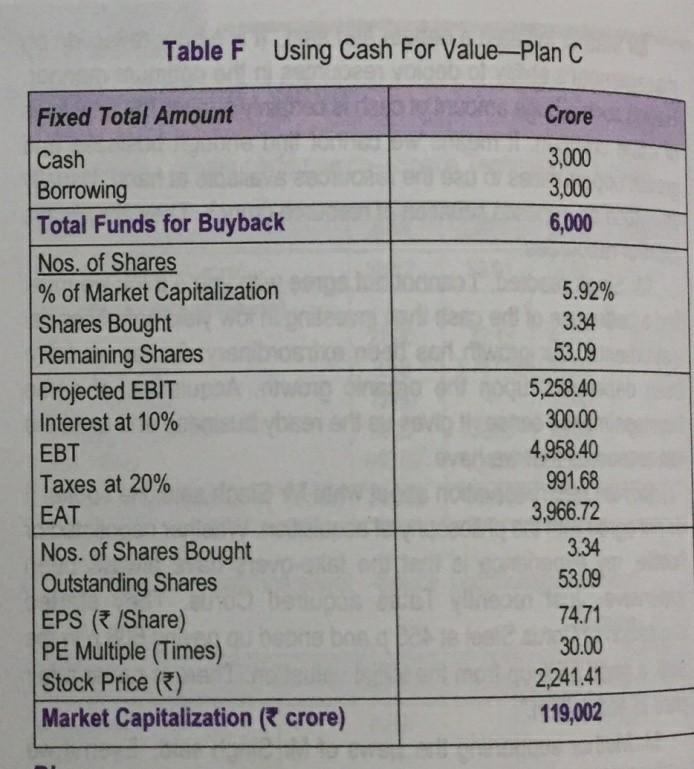
Table B Share performance-Space Technologies Limited 2005 2006 2007 53.91 54.93 56.43 Space Technologies Limited (STL) has been one of the market leaders in the field of software development. For a decade or so, it consistently outpaced its rivals in the industry and displayed phenomenal growth. Their growth in income levels, EBIT, and EPS has been of the order of 25-30% on a compounded basis for the last four years. It consistently followed the policy of dividend pay out of 20% of earnings. The performance of the company is depicted in Table A. Year 2004 Nos. of Shares (Crore) 53.12 Per Share Data (R/Share) EPS 21.20 DPS-Regular 3.69 DPS - Special 12.50 PE Multiple times) 30.22 Stock Price 640.62 Market Capitalization Crore) 34,028 32.13 41.45 60.32 5.757.50 11.50 15.00 32.59 33.62 29.76 1,046.98 1,393.56 1,795.05 56,446 76,553 101,303 Table C Balance sheet-Space Technologies Limited (Figures in ) Year 2006 2007 Table A Financial Performance-Space Technologies Limited ( crore) Year 2004 2005 2006 2007 CAGR (%) Income 4,761 6,860 9,028 13,149 27.61% EBITDA 1,584 2,325 2,989 4,225 26.55% Depreciation and Amortisation 231 268 409 469 EBIT 1,353 2,057 2,580 3,756 Interest EBT 1,353 2,057 2.580 3,756 27.77% Tax 227 325 303 352 EAT 1,732 2,277 3,404 30.41% Dividend-Regular 196 310 412 649 DividendSpecial 668 830 6,897 11,162 1,126 Net worth Debt Total Fixed Assets Investment Deferred Tax Asset Current Assets Less: Current Liabilities Net Current Assets TOTAL 6,897 2,133 876 56 6,049 2.217 3,832 6,897 11,162 3,107 839 79 8,961 1,824 7,137 11,162 Its performance at the stock exchanges too was impressive enough. Looking at the continuous growth of the STL, the market had discounted their earnings with a multiple of 30 consistently year after year. The management of STL was able to build the confidence of the market, not only through the consistent growth but also due to complete transparency to the shareholders in terms of disclosure of information far beyond what is prescribed under the law. These voluntary disclosures had made the STL as one of the darling shares in the stock market. Due to increased earnings, the compounded average growth rate for the shareholders was of the order of 30% ignoring the dividend yield. The market capitalization of the firm had increased almost three times from 34,000 crore to 101,000 crore in just last four years. The earnings and the PE multiple and the market capitalization are shown in Table B. Due to excellent financial performance and the margins in the business, the firm never felt it necessary to resort to borrowing as may be inferred from the balance sheet of STL in Table C. In fact, they had so much of cash that they could float a bank of their own. Besides being heavily oriented towards equity financing, the firm also successfully evaded any thoughts of unrelated diversification, which has been the desire of many cash rich firms all over the world. They remained focused on their core business of software development. Three top executives of the company, Mr Mathur, Mr Singh, and Mr Nair, all of whom had their basic qualification as MBA in Finance, were talking with lot of pride about the financial performance and continued growth and the success of the management to build the investors' confidence in creating value for the shareholders. Consistent with the management's philosophy they did not want to leave anything that could add to the value to the shareholder with each of them holding substantial employee stock options. While the performance of the stock and reward to shareholders, with respect to dividend pay out and capital appreciation, were more that exemplary there was only one single thought that was crossing their minds. Inordinately high and ever increasing amount of cash and cash equivalent available were suggesting that there was not enough or desired level of utilisation of the resources. Year 2006 2007 5,650 50.62% Cash and Cash Equivalent crore) Cash and Cash Equivalent to Total Asset (%) 4,463 64.71% The cash, which predominantly included bank deposits and investment in the liquid mutual funds were standing at more that 50% of the total assets. The amount of cash and cash equivalent was 35,650 crore as at the end of financial year 2007 Mr Mathur initiated a debate and said, 'It is a poor reflection on management's ability to deploy resources in the optimum manner. Having such a huge amount of cash is certainly against the principles of value creation. It means we cannot find enough business and growth opportunities to use the resources available at hand. Usually firms face an opposite situation of resource crunch. They are always short of resources.' Mr Singh reacted, 'I cannot but agree with you. I think we must find a better use of the cash than investing in low yield safe financial instruments. Our growth has been extraordinary. So far we have been dependent upon the organic growth. Acquisition of some business makes sense. It gives us the ready business and uses the idle resources that we have. Mr Nair had reservation about what Mr Singh said. He spoke, 'l do not agree with the philosophy of acquisition. Whether negotiated or hostile, my experience is that the take-overs have always been expensive. Just recently Tatas acquired Corus. They started acquisition of Corus Steel at 455 p and ended up paying 608 p in the deal, a good 35% up from the initial valuation. There is never a fair price in acquisition.' Mr Mathur supporting the views of Mr Singh said, 'Even if we pay something more than what the firm may deserve, it is still better than the keeping the resource idle. We would add greater value to the shareholders than what we are adding now. Mr Nair emphasized, "Having resources does not mean we waste it. To my mind keeping it for better use and waiting for the right opportunity is a better solution.' Mr Mathur came out with another suggestion. He said, 'Then let us return this cash back to the shareholders. We are unnecessarily following the policy of distribution of only 20% of earnings, whereas we may distribute more. Let shareholders find a better use of the cash in their individual capacities.' Mr Nair again disagreed and said, 'I think that would be a disservice to the shareholders. No one has complained why are we keeping so much cash with us. In fact our shareholders are more than happy with us. You can see it in the appreciation of our share price. In any case, the dividend does not constitute much of the return to the shareholders. We should rather continue with the 20% payout policy and distribute dividend on special occasions rather that regularly. Regular high dividend is misconstrued and raises unnecessary hopes. Mr Mathur reacted, 'In the last four years we have paid out R1,500 crore as special dividend and yet we have loads of cash investment company for several reasons, the most important being the risk of losing money. Shareholders would not approve of such a plan. Mr Singh said, 'I have an idea to use the cash. Why don't we use part of the cash and part of borrowing to buyback the shares. It would help add value in many ways - the number of shares would decrease for the same earning level, the EPS would improve as long as our interest cost remains within acceptable limits. All of them agreed to the proposal promising to return the next day with their proposed plan. Mr Mathur, Mr Singh, and Mr Nair submitted their plans named Plan A, B, and C as shown in Tables D, E, and F, respectively. All the plans had common assumptions of (a) a growth of 40% in EBIT over current levels, (b) availability of debt at 10% pre-tax cost, (c) repurchase of shares at the current market price, and d) corporate tax rate of 20%. The plans differed with each other as follows: Plan A assumed that the initial 3,000 crore required to fund the buyback would come from the available cash balance of *5,650 crore. Balance need of funds would be raised by debt. Plan B assumed that the initial funds to the extent of 2,500 crore would come from debt (approximately 25% of the current net worth) while for the remaining cash available would be utilized Plan C fixed the buyback level at 6,000 crore to be funded equally by debt and the available cash balance. Table D Using cash for valuePlan A (crore) Fixed Cash % of Shares Bought Back) 0% 3% 4% 5% 6% Funds Required Cash Loan Interest at 10% Projected EBIT Interest EBT Taxes at 20% EAT Nos. of Shares Bought Outstanding Shares EPS (R/Share) PE Multiple (Times) Stock Price ) Market Capitalization crore) 3,039.09 4,052.12 5,065.156,078.18 3,000.00 3,000.00 3,000.00 3,000.00 39.09 1,052,12 2,065.15 3,078.18 3.91 105.21 206.52 307.82 5,258.40 5,258,40 5,258.40 5,258.40 5,258.40 3.91 105.21 206.52 307.82 5,258.40 5.254.49 5.153.19 5,051.88 4,950.58 1,051.68 1,050.90 1,030.64 1.010.38 990.12 4,206.72 4,203.59 4.122.55 4.041.513,960.47 with us. 1.69 2.19 2.71 3.22 56.43 54.74 54.25 53.72 53.21 74.54 76.79 76.00 75.23 7443 30.00 30.00 30.00 30.00 30.00 2,236.24 2,303.69 2,279.96 2,256.88 2.232.87 Mr Nair suggested, 'We may invest in the stock market. That would give better yield than what we get in investing in fixed deposits with the bank and in liquid mutual funds. Mr Mathur agreed but said with some reservations, 'Yes certainly we may do it. But no company does that unless it is an 126,202 126,108 123,677 121,245 118,814 Table F Using Cash For ValuePlan C Fixed Total Amount Crore 3,000 3,000 6,000 Cash Borrowing Total Funds for Buyback Nos. of Shares % of Market Capitalization Shares Bought Remaining Shares Projected EBIT Interest at 10% EBT Taxes at 20% EAT Nos. of Shares Bought Outstanding Shares EPS (/Share) PE Multiple (Times) Stock Price (1) Market Capitalization crore) 5.92% 3.34 53.09 5,258.40 300.00 4,958.40 991.68 3,966.72 3.34 53.09 74.71 30.00 2,241.41 119,002 Table B Share performance-Space Technologies Limited 2005 2006 2007 53.91 54.93 56.43 Space Technologies Limited (STL) has been one of the market leaders in the field of software development. For a decade or so, it consistently outpaced its rivals in the industry and displayed phenomenal growth. Their growth in income levels, EBIT, and EPS has been of the order of 25-30% on a compounded basis for the last four years. It consistently followed the policy of dividend pay out of 20% of earnings. The performance of the company is depicted in Table A. Year 2004 Nos. of Shares (Crore) 53.12 Per Share Data (R/Share) EPS 21.20 DPS-Regular 3.69 DPS - Special 12.50 PE Multiple times) 30.22 Stock Price 640.62 Market Capitalization Crore) 34,028 32.13 41.45 60.32 5.757.50 11.50 15.00 32.59 33.62 29.76 1,046.98 1,393.56 1,795.05 56,446 76,553 101,303 Table C Balance sheet-Space Technologies Limited (Figures in ) Year 2006 2007 Table A Financial Performance-Space Technologies Limited ( crore) Year 2004 2005 2006 2007 CAGR (%) Income 4,761 6,860 9,028 13,149 27.61% EBITDA 1,584 2,325 2,989 4,225 26.55% Depreciation and Amortisation 231 268 409 469 EBIT 1,353 2,057 2,580 3,756 Interest EBT 1,353 2,057 2.580 3,756 27.77% Tax 227 325 303 352 EAT 1,732 2,277 3,404 30.41% Dividend-Regular 196 310 412 649 DividendSpecial 668 830 6,897 11,162 1,126 Net worth Debt Total Fixed Assets Investment Deferred Tax Asset Current Assets Less: Current Liabilities Net Current Assets TOTAL 6,897 2,133 876 56 6,049 2.217 3,832 6,897 11,162 3,107 839 79 8,961 1,824 7,137 11,162 Its performance at the stock exchanges too was impressive enough. Looking at the continuous growth of the STL, the market had discounted their earnings with a multiple of 30 consistently year after year. The management of STL was able to build the confidence of the market, not only through the consistent growth but also due to complete transparency to the shareholders in terms of disclosure of information far beyond what is prescribed under the law. These voluntary disclosures had made the STL as one of the darling shares in the stock market. Due to increased earnings, the compounded average growth rate for the shareholders was of the order of 30% ignoring the dividend yield. The market capitalization of the firm had increased almost three times from 34,000 crore to 101,000 crore in just last four years. The earnings and the PE multiple and the market capitalization are shown in Table B. Due to excellent financial performance and the margins in the business, the firm never felt it necessary to resort to borrowing as may be inferred from the balance sheet of STL in Table C. In fact, they had so much of cash that they could float a bank of their own. Besides being heavily oriented towards equity financing, the firm also successfully evaded any thoughts of unrelated diversification, which has been the desire of many cash rich firms all over the world. They remained focused on their core business of software development. Three top executives of the company, Mr Mathur, Mr Singh, and Mr Nair, all of whom had their basic qualification as MBA in Finance, were talking with lot of pride about the financial performance and continued growth and the success of the management to build the investors' confidence in creating value for the shareholders. Consistent with the management's philosophy they did not want to leave anything that could add to the value to the shareholder with each of them holding substantial employee stock options. While the performance of the stock and reward to shareholders, with respect to dividend pay out and capital appreciation, were more that exemplary there was only one single thought that was crossing their minds. Inordinately high and ever increasing amount of cash and cash equivalent available were suggesting that there was not enough or desired level of utilisation of the resources. Year 2006 2007 5,650 50.62% Cash and Cash Equivalent crore) Cash and Cash Equivalent to Total Asset (%) 4,463 64.71% The cash, which predominantly included bank deposits and investment in the liquid mutual funds were standing at more that 50% of the total assets. The amount of cash and cash equivalent was 35,650 crore as at the end of financial year 2007 Mr Mathur initiated a debate and said, 'It is a poor reflection on management's ability to deploy resources in the optimum manner. Having such a huge amount of cash is certainly against the principles of value creation. It means we cannot find enough business and growth opportunities to use the resources available at hand. Usually firms face an opposite situation of resource crunch. They are always short of resources.' Mr Singh reacted, 'I cannot but agree with you. I think we must find a better use of the cash than investing in low yield safe financial instruments. Our growth has been extraordinary. So far we have been dependent upon the organic growth. Acquisition of some business makes sense. It gives us the ready business and uses the idle resources that we have. Mr Nair had reservation about what Mr Singh said. He spoke, 'l do not agree with the philosophy of acquisition. Whether negotiated or hostile, my experience is that the take-overs have always been expensive. Just recently Tatas acquired Corus. They started acquisition of Corus Steel at 455 p and ended up paying 608 p in the deal, a good 35% up from the initial valuation. There is never a fair price in acquisition.' Mr Mathur supporting the views of Mr Singh said, 'Even if we pay something more than what the firm may deserve, it is still better than the keeping the resource idle. We would add greater value to the shareholders than what we are adding now. Mr Nair emphasized, "Having resources does not mean we waste it. To my mind keeping it for better use and waiting for the right opportunity is a better solution.' Mr Mathur came out with another suggestion. He said, 'Then let us return this cash back to the shareholders. We are unnecessarily following the policy of distribution of only 20% of earnings, whereas we may distribute more. Let shareholders find a better use of the cash in their individual capacities.' Mr Nair again disagreed and said, 'I think that would be a disservice to the shareholders. No one has complained why are we keeping so much cash with us. In fact our shareholders are more than happy with us. You can see it in the appreciation of our share price. In any case, the dividend does not constitute much of the return to the shareholders. We should rather continue with the 20% payout policy and distribute dividend on special occasions rather that regularly. Regular high dividend is misconstrued and raises unnecessary hopes. Mr Mathur reacted, 'In the last four years we have paid out R1,500 crore as special dividend and yet we have loads of cash investment company for several reasons, the most important being the risk of losing money. Shareholders would not approve of such a plan. Mr Singh said, 'I have an idea to use the cash. Why don't we use part of the cash and part of borrowing to buyback the shares. It would help add value in many ways - the number of shares would decrease for the same earning level, the EPS would improve as long as our interest cost remains within acceptable limits. All of them agreed to the proposal promising to return the next day with their proposed plan. Mr Mathur, Mr Singh, and Mr Nair submitted their plans named Plan A, B, and C as shown in Tables D, E, and F, respectively. All the plans had common assumptions of (a) a growth of 40% in EBIT over current levels, (b) availability of debt at 10% pre-tax cost, (c) repurchase of shares at the current market price, and d) corporate tax rate of 20%. The plans differed with each other as follows: Plan A assumed that the initial 3,000 crore required to fund the buyback would come from the available cash balance of *5,650 crore. Balance need of funds would be raised by debt. Plan B assumed that the initial funds to the extent of 2,500 crore would come from debt (approximately 25% of the current net worth) while for the remaining cash available would be utilized Plan C fixed the buyback level at 6,000 crore to be funded equally by debt and the available cash balance. Table D Using cash for valuePlan A (crore) Fixed Cash % of Shares Bought Back) 0% 3% 4% 5% 6% Funds Required Cash Loan Interest at 10% Projected EBIT Interest EBT Taxes at 20% EAT Nos. of Shares Bought Outstanding Shares EPS (R/Share) PE Multiple (Times) Stock Price ) Market Capitalization crore) 3,039.09 4,052.12 5,065.156,078.18 3,000.00 3,000.00 3,000.00 3,000.00 39.09 1,052,12 2,065.15 3,078.18 3.91 105.21 206.52 307.82 5,258.40 5,258,40 5,258.40 5,258.40 5,258.40 3.91 105.21 206.52 307.82 5,258.40 5.254.49 5.153.19 5,051.88 4,950.58 1,051.68 1,050.90 1,030.64 1.010.38 990.12 4,206.72 4,203.59 4.122.55 4.041.513,960.47 with us. 1.69 2.19 2.71 3.22 56.43 54.74 54.25 53.72 53.21 74.54 76.79 76.00 75.23 7443 30.00 30.00 30.00 30.00 30.00 2,236.24 2,303.69 2,279.96 2,256.88 2.232.87 Mr Nair suggested, 'We may invest in the stock market. That would give better yield than what we get in investing in fixed deposits with the bank and in liquid mutual funds. Mr Mathur agreed but said with some reservations, 'Yes certainly we may do it. But no company does that unless it is an 126,202 126,108 123,677 121,245 118,814 Table F Using Cash For ValuePlan C Fixed Total Amount Crore 3,000 3,000 6,000 Cash Borrowing Total Funds for Buyback Nos. of Shares % of Market Capitalization Shares Bought Remaining Shares Projected EBIT Interest at 10% EBT Taxes at 20% EAT Nos. of Shares Bought Outstanding Shares EPS (/Share) PE Multiple (Times) Stock Price (1) Market Capitalization crore) 5.92% 3.34 53.09 5,258.40 300.00 4,958.40 991.68 3,966.72 3.34 53.09 74.71 30.00 2,241.41 119,002
Step by Step Solution
There are 3 Steps involved in it

Get step-by-step solutions from verified subject matter experts