

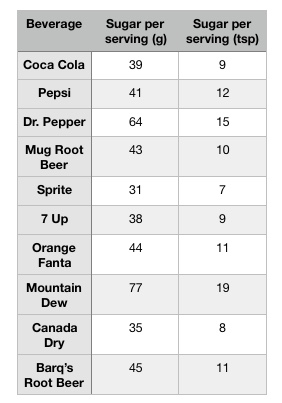
Question: -Compare Raw Data Distribution to Standard Normal Distribution. Using your raw data gathered and the sample mean and sample standard deviation calculated percentage of your
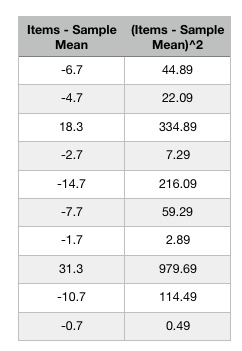
-Compare Raw Data Distribution to "Standard" Normal Distribution. Using your raw data gathered and the sample mean and sample standard deviation calculated percentage of your raw data falling within one standard deviation of the mean; percentage of your raw data falling within two standard deviations of the mean; percentage of your raw data falling within three standard deviations of the mean.
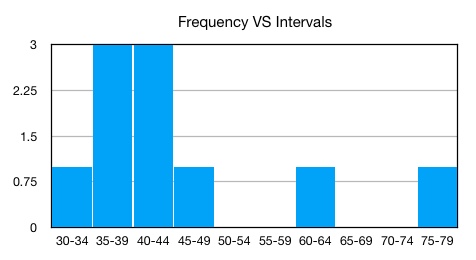
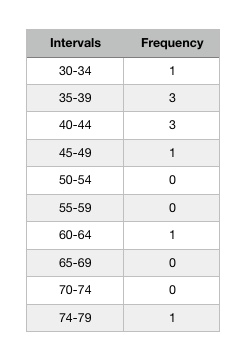
-Communicating Evaluation, Analysis, Results, and Conclusions. Provide two to three paragraphs that: interpret your statistics and graphs; answer whether your percentages calculated indicate that your data distribution (shown in the histogram) is the same as the 68/95/99.5% "standard" normal distribution? Be sure to explain why you think your data distribution does or does not match the "standard" normal distribution. relate to the purpose of the project.
\f\f\f\f
Step by Step Solution
There are 3 Steps involved in it

Get step-by-step solutions from verified subject matter experts