

Question: Compare ROE and RNOA and identify differences over time. Evaluate the companies' returns and answer questions such as the following: Which year is more profitable?
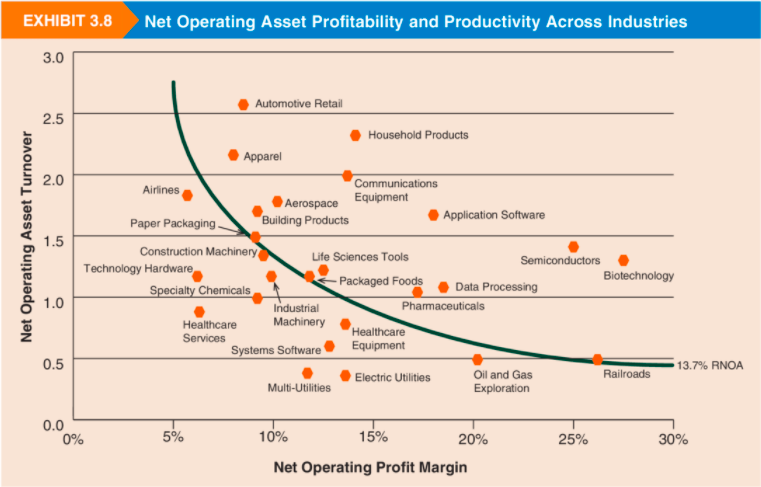
- Compare ROE and RNOA and identify differences over time. Evaluate the companies' returns and answer questions such as the following: Which year is more profitable? How do the operating and non-operating portions of ROE compare? Compare the ROE and RNOA with the graph below. If the ratios for the companies under analysis differ from the graph, is there an explanation? Is the net operating profit margin similar for the two companies? Given that they are roughly in the same industry, major differences should prompt further exploration. Are the companies' net operating asset turnover ratios similar or markedly different? Calculate and compare the cash conversion cycle for each year.
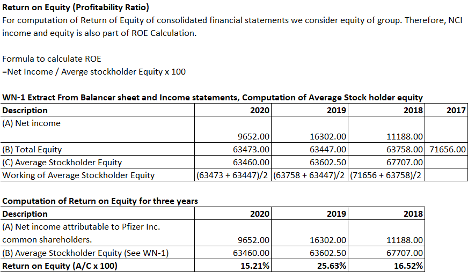
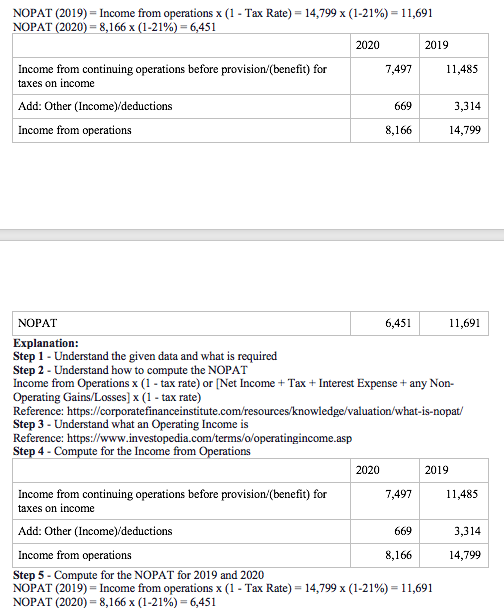
Return on Equity (Profitability Ratio) For computation of Return of Equity of consolidated financial statements we consider equity ol group. Therefore, NCI income and equity is also part of ROC Calculation. Formula to calculate ROE - Net Income / Avenge stockholder Equity x 100 WN-1 Extract From Balancer sheet and Income statements, Computation of Average Stock holder equity Description 2020 2019 2018 2017 (A) Net income 9652.00 16302.00 11188.00 (B) Total Equity 63473.00 63447.00 63758.0071656.00 (C) Average Stockholder Equity 63460.00 63602.50 67707.00 Working of Average Stockholdet Equity (62473 +634471/2 16.3758 +624477/2 (71656 +637567/2 2020 2019 2018 Computation of Return on Equity for three years Description (A) Net income attributable to Pfizer Inc. common shareholders. B) Average Stockholder Equity (See WN-1) 1 Return on Equity (A/C x 100) 9652.00 63460.00 15.21% 16302.00 63602.50 25.63% 11188.00 67707.00 16.52% NOPAT (2019) = Income from operations x (1 - Tax Rate) = 14,799 x (1-21%) = 11,691 NOPAT (2020) = 8,166 X (1-21%) = 6,451 2020 2019 Income from continuing operations before provision/(benefit) for 7,497 11,485 taxes on income Add: Other (Income)/deductions 669 3,314 Income from operations 8,166 14,799 NOPAT 6,451 11,691 Explanation: Step 1 - Understand the given data and what is required Step 2 - Understand how to compute the NOPAT Income from Operations x (1 - tax rate) or (Net Income + Tax + Interest Expense + any Non- Operating Gains/Losses) x (1 - tax rate) Reference: https://corporatefinanceinstitute.com/resources/knowledge/valuation/what-is-nopat/ Step 3 - Understand what an Operating Income is Reference: https://www.investopedia.com/terms/o/operatingincome.asp Step 4 - Compute for the Income from Operations 2019 Income from continuing operations before provision/(benefit) for 7,497 11,485 taxes on income Add: Other (Income)/deductions 669 3,314 Income from operations 8,166 14,799 Step 5 - Compute for the NOPAT for 2019 and 2020 NOPAT (2019) = Income from operations x (1 - Tax Rate) = 14,799 x (1-21%) = 11,691 NOPAT (2020) = 8,166 x (1-21%) = 6,451 2020 EXHIBIT 3.8 Net Operating Asset Profitability and Productivity Across Industries 3.0 2 2.5 2.0 Net Operating Asset Turnover 1.5 Automotive Retail Household Products Apparel Airlines Communications Aerospace Equipment Paper Packaging Building Products Application Software Construction Machinery Life Sciences Tools Semiconductors Technology Hardware Biotechnology Specialty Chemicals Packaged Foods Data Processing Industrial Pharmaceuticals Healthcare Machinery Healthcare Services Systems Software Equipment Electric Utilities 13.7% RNOA Railroads Oil and Gas Multi-Utilities Exploration 1.0 0.5 0.0 0% 5% 10% 15% 20% 25% 30% Net Operating Profit Margin Return on Equity (Profitability Ratio) For computation of Return of Equity of consolidated financial statements we consider equity ol group. Therefore, NCI income and equity is also part of ROC Calculation. Formula to calculate ROE - Net Income / Avenge stockholder Equity x 100 WN-1 Extract From Balancer sheet and Income statements, Computation of Average Stock holder equity Description 2020 2019 2018 2017 (A) Net income 9652.00 16302.00 11188.00 (B) Total Equity 63473.00 63447.00 63758.0071656.00 (C) Average Stockholder Equity 63460.00 63602.50 67707.00 Working of Average Stockholdet Equity (62473 +634471/2 16.3758 +624477/2 (71656 +637567/2 2020 2019 2018 Computation of Return on Equity for three years Description (A) Net income attributable to Pfizer Inc. common shareholders. B) Average Stockholder Equity (See WN-1) 1 Return on Equity (A/C x 100) 9652.00 63460.00 15.21% 16302.00 63602.50 25.63% 11188.00 67707.00 16.52% NOPAT (2019) = Income from operations x (1 - Tax Rate) = 14,799 x (1-21%) = 11,691 NOPAT (2020) = 8,166 X (1-21%) = 6,451 2020 2019 Income from continuing operations before provision/(benefit) for 7,497 11,485 taxes on income Add: Other (Income)/deductions 669 3,314 Income from operations 8,166 14,799 NOPAT 6,451 11,691 Explanation: Step 1 - Understand the given data and what is required Step 2 - Understand how to compute the NOPAT Income from Operations x (1 - tax rate) or (Net Income + Tax + Interest Expense + any Non- Operating Gains/Losses) x (1 - tax rate) Reference: https://corporatefinanceinstitute.com/resources/knowledge/valuation/what-is-nopat/ Step 3 - Understand what an Operating Income is Reference: https://www.investopedia.com/terms/o/operatingincome.asp Step 4 - Compute for the Income from Operations 2019 Income from continuing operations before provision/(benefit) for 7,497 11,485 taxes on income Add: Other (Income)/deductions 669 3,314 Income from operations 8,166 14,799 Step 5 - Compute for the NOPAT for 2019 and 2020 NOPAT (2019) = Income from operations x (1 - Tax Rate) = 14,799 x (1-21%) = 11,691 NOPAT (2020) = 8,166 x (1-21%) = 6,451 2020 EXHIBIT 3.8 Net Operating Asset Profitability and Productivity Across Industries 3.0 2 2.5 2.0 Net Operating Asset Turnover 1.5 Automotive Retail Household Products Apparel Airlines Communications Aerospace Equipment Paper Packaging Building Products Application Software Construction Machinery Life Sciences Tools Semiconductors Technology Hardware Biotechnology Specialty Chemicals Packaged Foods Data Processing Industrial Pharmaceuticals Healthcare Machinery Healthcare Services Systems Software Equipment Electric Utilities 13.7% RNOA Railroads Oil and Gas Multi-Utilities Exploration 1.0 0.5 0.0 0% 5% 10% 15% 20% 25% 30% Net Operating Profit Margin
Step by Step Solution
There are 3 Steps involved in it

Get step-by-step solutions from verified subject matter experts