

Question: Compare the 2 different companies graphs that just went through Horizontal Analysis? CASH AND EQUIVALENTS Long-term debt 140.00 900.00 300.00 120.00% 700.00% 100.00% 600.00 80.00%
Compare the 2 different companies graphs that just went through Horizontal Analysis?
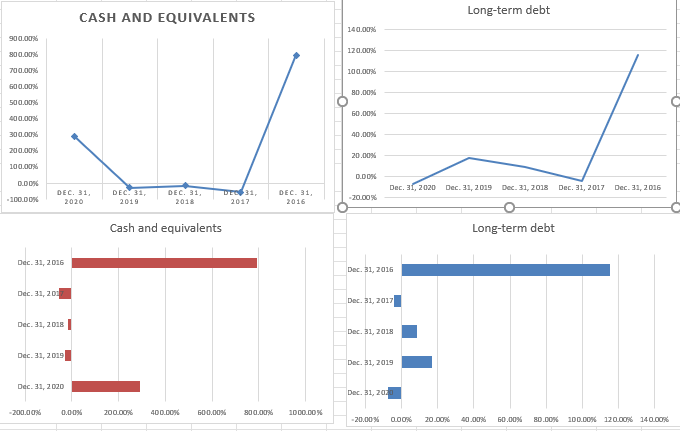
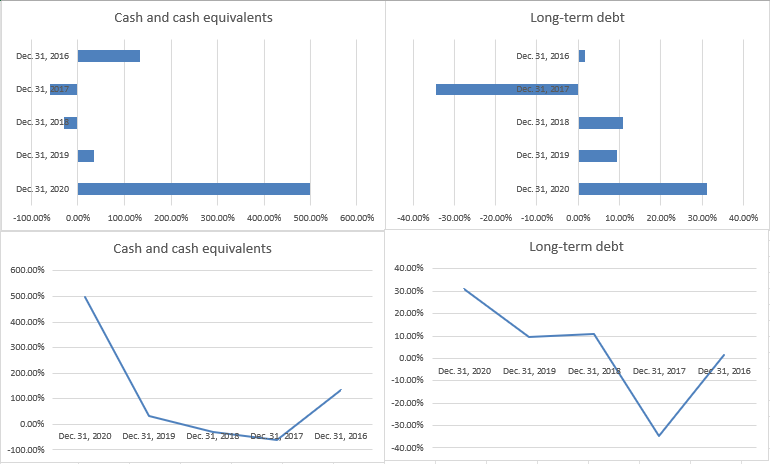
CASH AND EQUIVALENTS Long-term debt 140.00 900.00 300.00 120.00% 700.00% 100.00% 600.00 80.00% 500.00 60.00% 400.00% 300.00 40.00% 200.00 20.00% 100.00% 0.00% D.D0% Dec 31, 2020 Dec 31, 2019 Dec 31, 2018 Dec 31, 2017 Dec 31, 2016 -100.00% DEC. 31, 2020 DEC 31, 2019 DEC 31. 2018 DEC 31, 2016 -20.00 2017 Cash and equivalents Long-term debt Dec 31, 2016 Dec. 31, 2016 Dec 31, 20 Dec 31, 2017 Dec 31, 2018 Dec 31, 2018 Dec 31, 2019 Dec 31, 2019 Dec 31, 2020 Dec. 31, 202 -200.00% 0.00% 200.00% 400.00 600.00% 800.00 1000.00% -20.00% CLOOR 20.00% 40.00% 60.00% 20.00 100.0 80.00% 100.00% 120.00% 140.00% Cash and cash equivalents Long-term debt Dec 31, 2016 Dec 31, 2016 Dec 31, Dec 31, 2017 Dec 31, 201 Dec. 31, 2018 Dec 31, 2019 Dec. 31, 2019 Dec 31, 2020 Dec. 31, 2020 -100.00% 0.00% 100.00% 200.00% 300.00% 400.00% 500.00% 600.0096 -40.00% -30.00% -20.00% -10.00% 0.00% 10.0096 20.00 30.00% 40.00% Cash and cash equivalents Long-term debt 600.00% 40.00% 500.00% 30.00% 20.00% 400.00% 10.00% 300.00% 0.00% 200.00% Dec. 31, 2020 Dec 31, 2019 Dec 31, 2018 Dec 31, 2017 Dec 31, 2016 -10.00% 100.00% -20.00% 0.0096 -30.00% Dec 31, 2020 Dec 31, 2019 Dec. 31, 2016 Dec 31, 2017 Dec. 31, 2016 -100.00% -40.0095
Step by Step Solution
There are 3 Steps involved in it

Get step-by-step solutions from verified subject matter experts