

Question: Compare the box and whisker plots for the three sections of test takers.a. Students in section A get the following grades on a test (graded
Compare the box and whisker plots for the three sections of test takers.a. Students in section A get the following grades on a test (graded out of a 100): 72, 74, 78, 78, 79, 80, 80, 85, 85, 86, 86, 94, 98, 98, 100identify the main median (Q2): identify the lower median (Q1):identify the higher median (Q3): Place the boxes and whisker lines along the number line that spans the grades:0 10 20 30 40 50 60 70 80 90 100b. Students in section B get the following grades on a test (graded out of a 100): 36, 42, 44, 47, 52, 55, 67, 72, 80, 85, 85, 86, 94, 95identify the main median (Q2): identify the lower median (Q1):identify the higher median (Q3): Place the boxes and whisker lines along the number line that spans the grades (Remember, if there are two numbers for the median, take the value that lies half way between the two.)0 10 20 30 40 50 60 70 80 90 100c. Students in section C get the following grades on a test (graded out of a 100): 1(one), 100, 100,100, 100, 100, 100, 100, 100, 100, 100, 100identify the main median (Q2): identify the lower median (Q1):identify the higher median (Q3): Place the boxes and whisker lines along the number line that spans the grades:0 10 20 30 40 50 60 70 80 90 100d. Now line up the box plots for the three sections A, B, C, and compare the performances of the three sections. 0 10 20 30 40 50 60 70 80 90 100? How can you use the box and whisker plots to determine which section did the best?? How can you use the box and whisker plots to determine the widest range of grade distribution? (This can be answered in two different ways.)
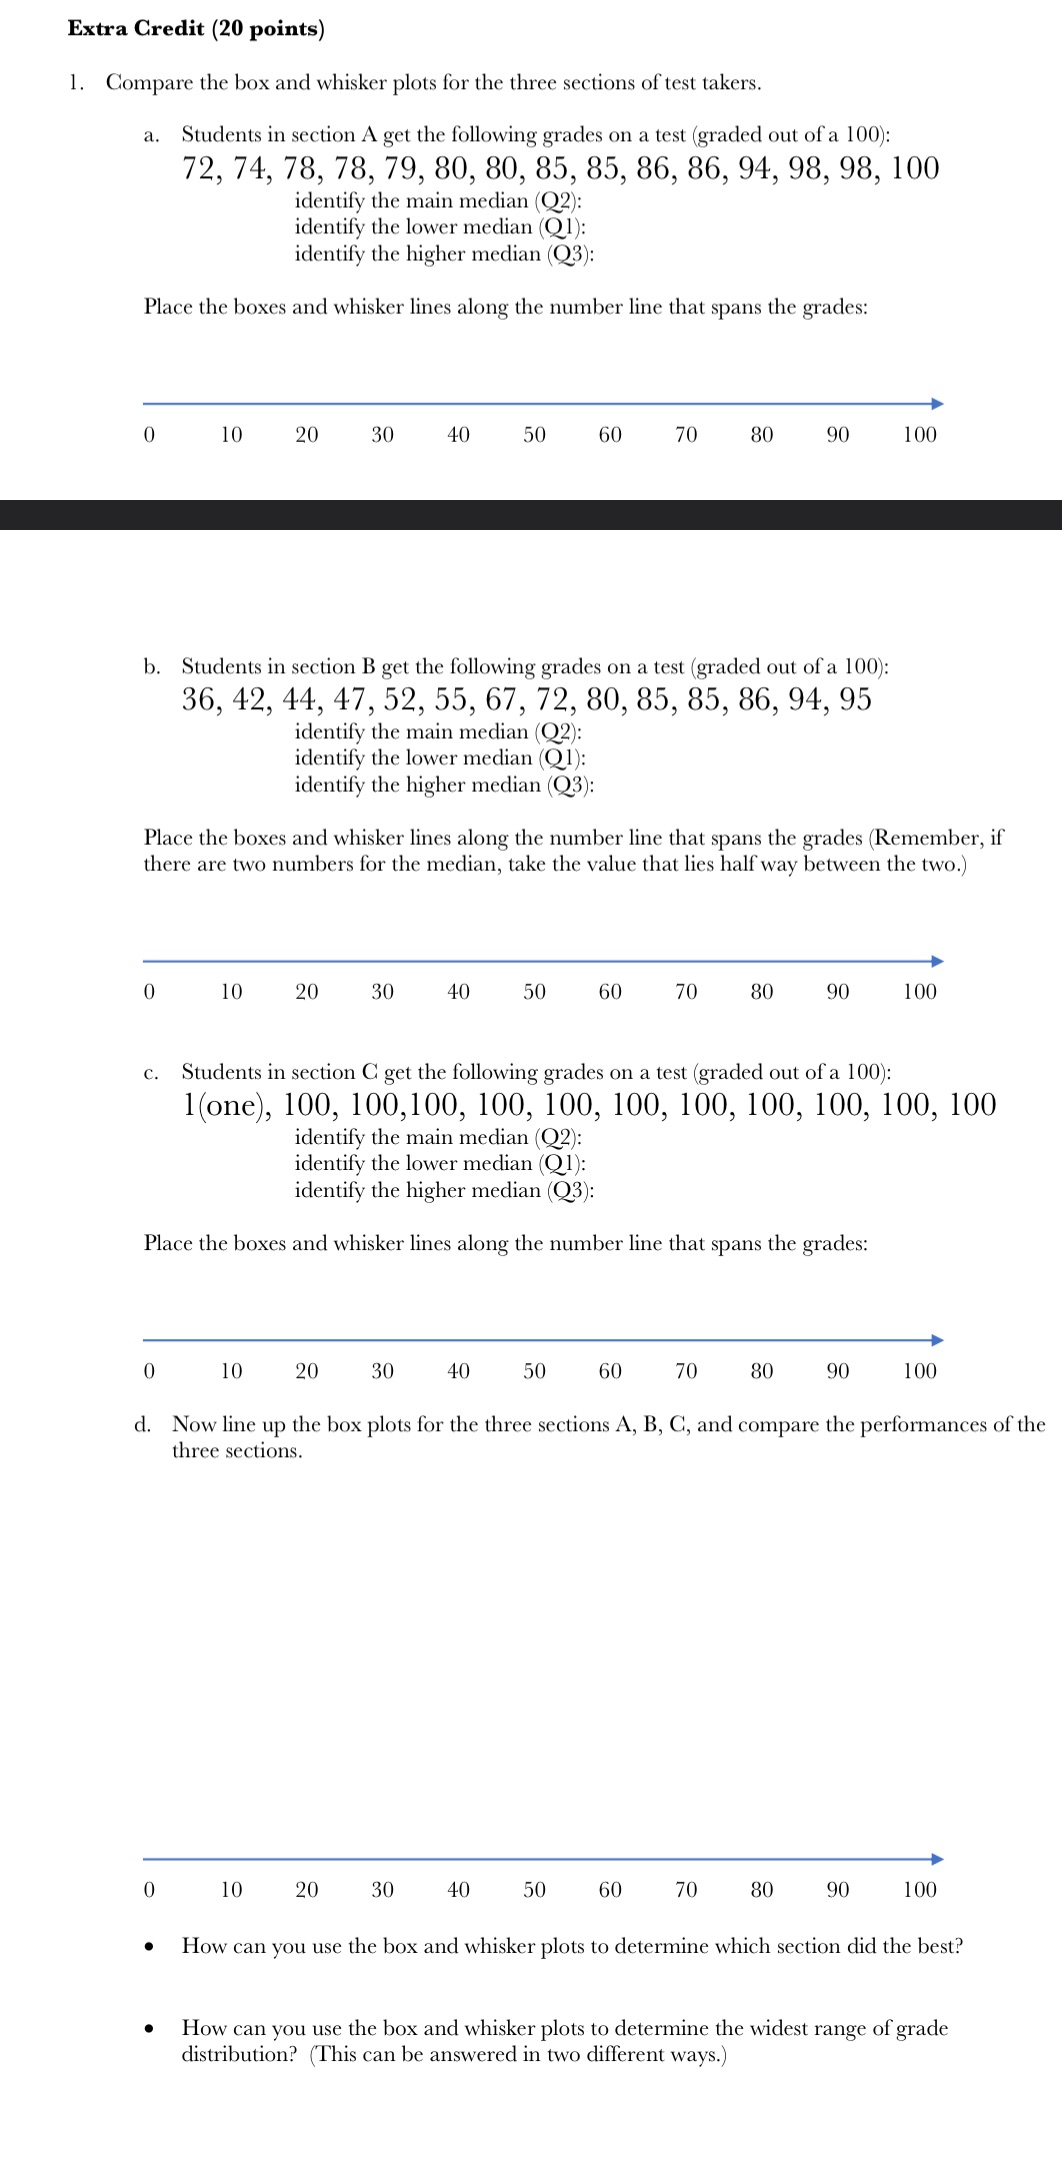
Extra Credit (20 points) 1. Compare the box and whisker plots for the three sections of test takers. a. Students in section A get the following grades on a test (graded out of a 100): 72, 74, 78, 78, 79, 80, 80, 85, 85, 86, 86, 94, 98, 98, 100 identify the main median (Q2): identify the lower median (Q1): identify the higher median (Q3): Place the boxes and whisker lines along the number line that spans the grades: 10 20 30 40 50 60 70 80 90 100 b. Students in section B get the following grades on a test (graded out of a 100): 36, 42, 44, 47, 52, 55, 67, 72, 80, 85, 85, 86, 94, 95 identify the main median (Q2): identify the lower median (Q1): identify the higher median (Q3): Place the boxes and whisker lines along the number line that spans the grades (Remember, if there are two numbers for the median, take the value that lies half way between the two.) 0 10 20 30 40 50 60 70 80 90 100 c. Students in section C get the following grades on a test (graded out of a 100): 1 (one), 100, 100,100, 100, 100, 100, 100, 100, 100, 100, 100 identify the main median (Q2): identify the lower median (Q1): identify the higher median (Q3): Place the boxes and whisker lines along the number line that spans the grades: 0 10 20 30 40 50 60 70 80 90 100 d. Now line up the box plots for the three sections A, B, C, and compare the performances of the three sections. 0 10 20 30 40 50 60 70 80 90 100 How can you use the box and whisker plots to determine which section did the best? How can you use the box and whisker plots to determine the widest range of grade distribution? (This can be answered in two different ways.)
Step by Step Solution
There are 3 Steps involved in it

Get step-by-step solutions from verified subject matter experts