

Question: Compare the differences in returns and standard deviations in the three sets of data, and discuss their investment implications using a cell within the spreadsheet
Compare the differences in returns and standard deviations in the three sets of data, and discuss their investment implications using a cell within the spreadsheet document.
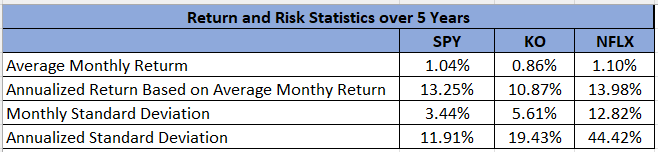
\begin{tabular}{|l|c|c|c|} \hline \multicolumn{4}{|c|}{ Return and Risk Statistics over 5 Years } \\ \hline & SPY & KO & NFLX \\ \hline Average Monthly Returm & 1.04% & 0.86% & 1.10% \\ \hline Annualized Return Based on Average Monthy Return & 13.25% & 10.87% & 13.98% \\ \hline Monthly Standard Deviation & 3.44% & 5.61% & 12.82% \\ \hline Annualized Standard Deviation & 11.91% & 19.43% & 44.42% \\ \hline \end{tabular}
Step by Step Solution
There are 3 Steps involved in it
1 Expert Approved Answer
Step: 1 Unlock

Question Has Been Solved by an Expert!
Get step-by-step solutions from verified subject matter experts
Step: 2 Unlock
Step: 3 Unlock