

Question: Compare the means for the two experimental groups. Does the pattern of mean differences match your predictions from question #d? From simply a descriptive standpoint,
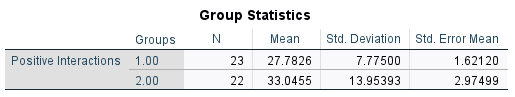
Compare the means for the two experimental groups. Does the pattern of mean differences match your predictions from question #d? From simply a descriptive standpoint, how you characterize the magnitude of the difference in means between the treatment and control groups (e.g., small, medium, large)? On #d I predicted there would be a higher number of positive interactions for officers who wore body cameras. Explain your rationale Group Statistics Groups N Mean Std. Deviation Std. Error MeanPositive Interactions 1.00 23 27.7826 7.77500 1.62120 2.00 22 33.0455 13.95393 2.97499
Step by Step Solution
There are 3 Steps involved in it
1 Expert Approved Answer
Step: 1 Unlock

Question Has Been Solved by an Expert!
Get step-by-step solutions from verified subject matter experts
Step: 2 Unlock
Step: 3 Unlock