

Question: Compare the results for the OECD and non-OECD samples. Do the intercepts and the effects of price and income appear to be similar across these
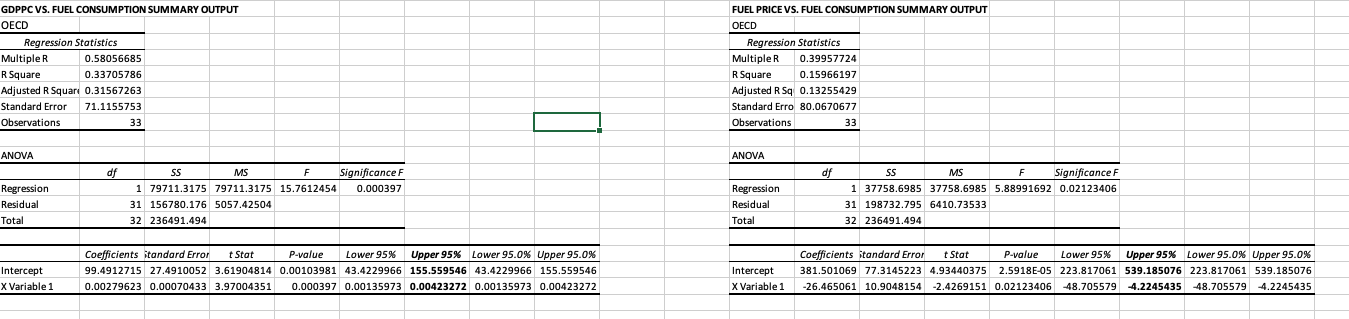

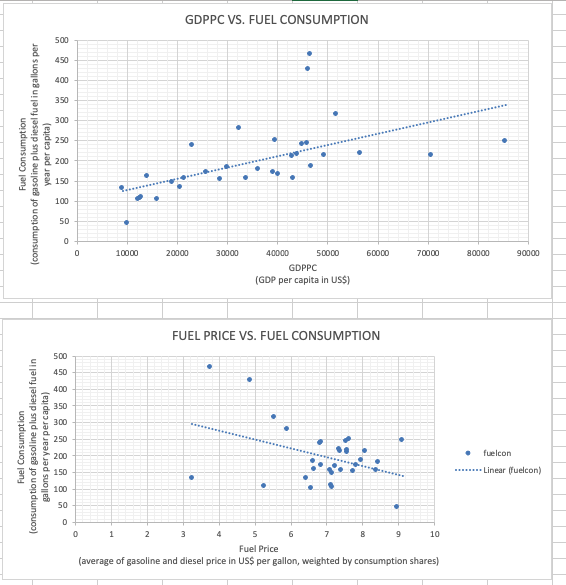

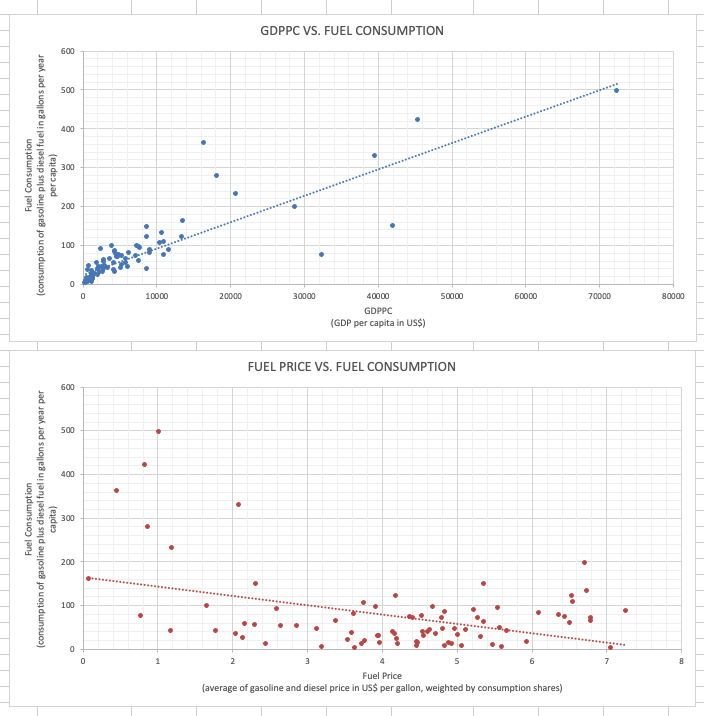
Compare the results for the OECD and non-OECD samples. Do the intercepts and the effects of price and income appear to be similar across these groups of countries? In comparing across regressions, use the 95% confidence intervals to give a rough idea whether the estimates are "close" to each other or quite different. What do you think might account for any substantial differences? OECD COUNTRIES

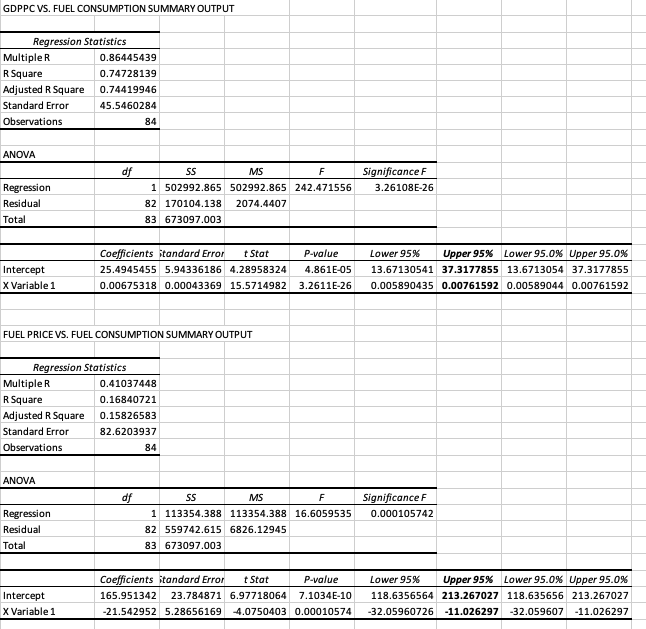

GDPPC VS. FUEL CONSUMPTION SUMMARY OUTPUT FUEL PRICE VS. FUEL CONSUMPTION SUMMARY OUTPUT OECD OECD Regression Statistics Regression Statistics Multiple R 0.58056685 Multiple R 0.39957724 R Square 0.33705786 R Square 0.15966197 Adjusted R Square 0.31567263 Adjusted R Sq 0.13255429 Standard Error 71.1155753 Standard Erro 80.0670677 Observations 33 Observations 33 ANOVA ANOVA 55 MS F Significance F df SS MS F Significance F Regression 1 79711.3175 79711.3175 15.7612454 0.000397 Regression 1 37758.6985 37758.6985 5.88991692 0.02123406 Residual 31 156780.176 5057.42504 Residual 31 198732.795 6410.73533 Total 32 236491.494 Total 32 236491.494 Coefficients itandard Error t Stat P-value Lower 95% Upper 95% Lower 95.0%% Upper 95.0%% Coefficients Standard Error Stat P-value Lower 95% Upper 95%% Lower 95.0% Upper 95.0% Intercept 99.4912715 27.4910052 3.61904814 0.00103981 43.4229966 155.559546 43.4229966 155.559546 Intercept 381.501069 77.3145223 4.93440375 2.5918E-05 223.817061 539.185076 223.817061 539.185076 X Variable 1 0.00279623 0.00070433 3.97004351 0.000397 0.00135973 0.00423272 0.00135973 0.00423272 X Variable 1 -26.465061 10.9048154 -2.4269151 0.02123406 -48.705579 -4.2245435 -48.705579 -4.2245435GDPPC VS. FUEL CONSUMPTION SUMMARY OUTPUT Regression Statistics Multiple R 0.86445439 R Square 0.74728139 Adjusted R Square 0.74419946 Standard Error 45.5460284 Observations 84 ANOVA df 55 MS F Significance F Regression 1 502992.865 502992.865 242.471556 3.26108E-26 Residual 82 170104.138 2074.4407 Total 83 673097.003 Coefficients itandard Error t Stat P-value Lower 95%% Upper 95%% Lower 95.0% Upper 95.0% Intercept 25.4945455 5.94336186 4.28958324 4.8618-05 13.67130541 37.3177855 13.6713054 37.3177855 * Variable 1 0.00675318 0.00043369 15.5714982 3.2611E-26 0.005890435 0.00761592 0.00589044 0.00761592 FUEL PRICE VS. FUEL CONSUMPTION SUMMARY OUTPUT Regression Statistics Multiple R 0.41037448 R Square 0.16840721 Adjusted R Square 0.15826583 Standard Error 82.6203937 Observations 84 ANOVA df MS F Significance F Regression 1 113354.388 113354.388 16.6059535 0.000105742 Residual 82 559742.615 6826.12945 Total 83 673097.003 Coefficients itandard Error t Stat P-value Lower 95% Upper 95% Lower 95.0% Upper 95.0% Intercept 165.951342 23.784871 6.97718064 7.1034E-10 118.6356564 213.267027 118.635656 213.267027 X Variable 1 -21.542952 5.28656169 -4.0750403 0.00010574 -32.05960726 -11.026297 -32.059607 -11.026297GDPPC VS. FUEL CONSUMPTION 500 400 350 300 250 (consumption of gasoline plus diesel fuel in gallons per Fuel Consumption year per capita] 200 150 100 50 10000 20000 30000 400 00 50000 60000 70000 80000 0DO06 GDPPC (GDP per capita in US$] FUEL PRICE VS. FUEL CONSUMPTION 500 (consumption of gasoline plus diesel fuel in Fuel Consumption gallons per year per capita) fuelcon .Linear [fuelcon) 2 5 6 7 9 10 Fuel Price (average of gasoline and diesel price in US$ per gallon, weighted by consumption shares)GDPPC VS. FUEL CONSUMPTION 60 500 400 3:00 Fuel Consumption (consumption of gasoline plus diesel fuel in gallons per year per capita) 200 60000 700 00 80000 30000 40000 50000 10000 200 00 GDPPC (GDP per capita in US$) FUEL PRICE VS. FUEL CONSUMPTION 500 400 capital (consumption of gasoline plus diesel fuel in gallons per year per Fuel Consumption 300 200 100 6 0 Fuel Price (average of gasoline and diesel price in US$ per gallon, weighted by consumption shares)
Step by Step Solution
There are 3 Steps involved in it

Get step-by-step solutions from verified subject matter experts