

Question: compare these financial ratios between Meta and Snap SNAP 2017 2018 2019 2020 2021 TTM Valuation P/E 18.31 12.15 13.63 14.96 14.44 13.39 EV/EBIT 12.84
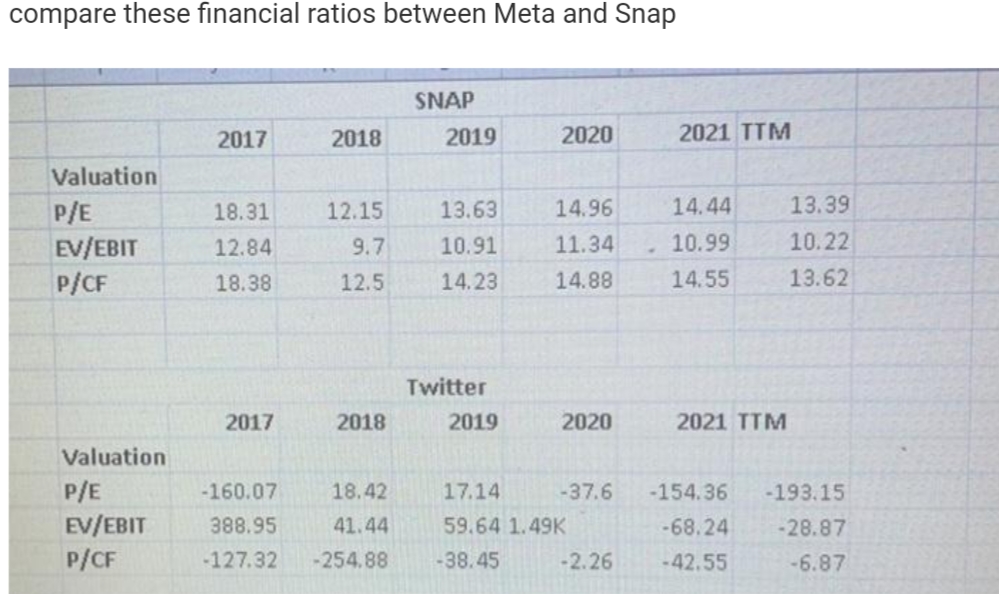
compare these financial ratios between Meta and Snap SNAP 2017 2018 2019 2020 2021 TTM Valuation P/E 18.31 12.15 13.63 14.96 14.44 13.39 EV/EBIT 12.84 9.7 10.91 11.34 10.99 10.22 P/CF 18.38 12.5 14.23 14.88 14.55 13.62 Twitter 2017 2018 2019 2020 2021 TTM Valuation P/E -160.07 18.42 17.14 -37.6 -154.36 -193.15 EV/EBIT 388.95 41.44 59.64 1.49K -68.24 -28.87 P/CF -127.32 -254.88 -38.45 -2.26 -42.55 -6.87
Step by Step Solution
There are 3 Steps involved in it
1 Expert Approved Answer
Step: 1 Unlock

Question Has Been Solved by an Expert!
Get step-by-step solutions from verified subject matter experts
Step: 2 Unlock
Step: 3 Unlock