

Question: Comparing the Bohr Model to Experimental Data Comparing the Bohr Model to Experimental Data /4 point: Shown below are the photoelectron spectra (PES) for hydrogen
Comparing the Bohr Model to Experimental Data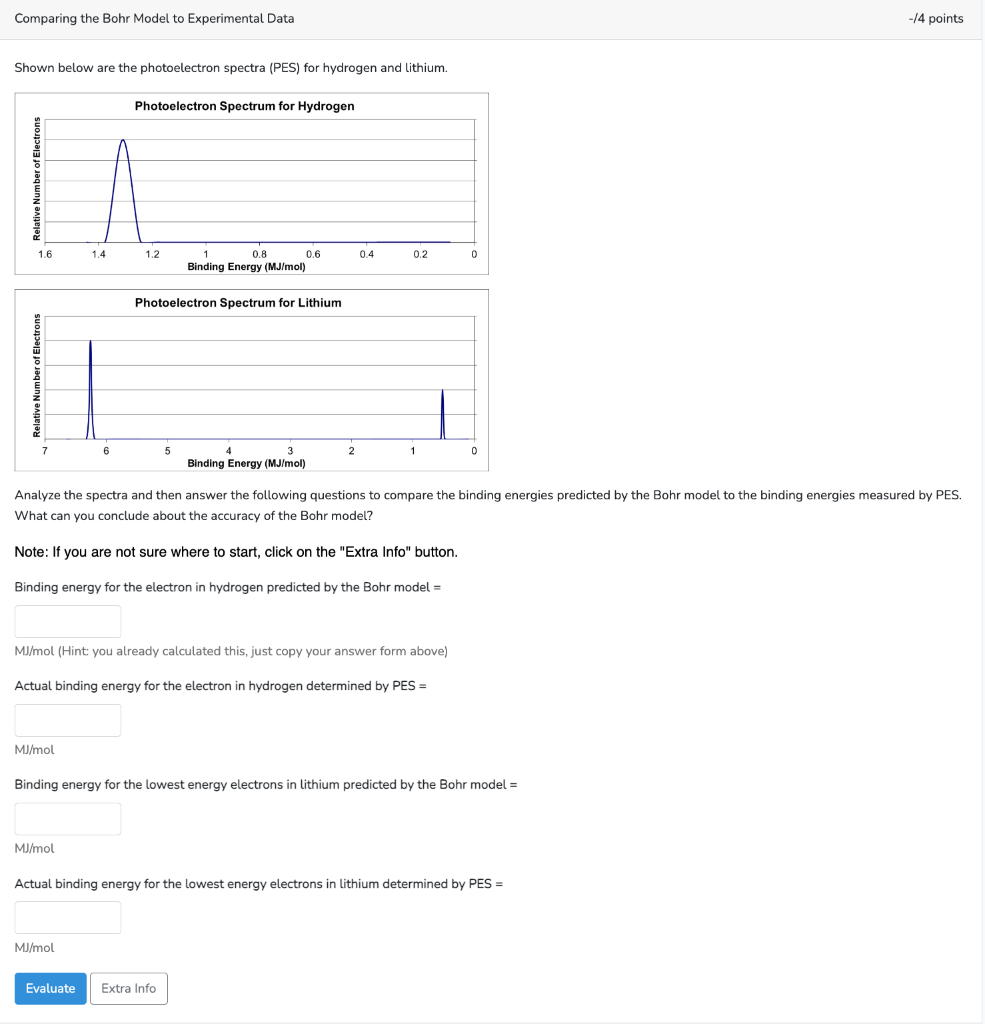
Comparing the Bohr Model to Experimental Data /4 point: Shown below are the photoelectron spectra (PES) for hydrogen and lithium. Analyze the spectra and then answer the following questions to compare the binding energies predicted by the Bohr model to the binding energies measured by What can you conclude about the accuracy of the Bohr model? Note: If you are not sure where to start, click on the "Extra Info" button. Binding energy for the electron in hydrogen predicted by the Bohr model = MJ/mol (Hint: you already calculated this, just copy your answer form above) Actual binding energy for the electron in hydrogen determined by PES = MJ/mol Binding energy for the lowest energy electrons in lithium predicted by the Bohr model = MJ/mol Actual binding energy for the lowest energy electrons in lithium determined by PES = MJ/mol Comparing the Bohr Model to Experimental Data /4 point: Shown below are the photoelectron spectra (PES) for hydrogen and lithium. Analyze the spectra and then answer the following questions to compare the binding energies predicted by the Bohr model to the binding energies measured by What can you conclude about the accuracy of the Bohr model? Note: If you are not sure where to start, click on the "Extra Info" button. Binding energy for the electron in hydrogen predicted by the Bohr model = MJ/mol (Hint: you already calculated this, just copy your answer form above) Actual binding energy for the electron in hydrogen determined by PES = MJ/mol Binding energy for the lowest energy electrons in lithium predicted by the Bohr model = MJ/mol Actual binding energy for the lowest energy electrons in lithium determined by PES = MJ/mol
Step by Step Solution
There are 3 Steps involved in it

Get step-by-step solutions from verified subject matter experts