

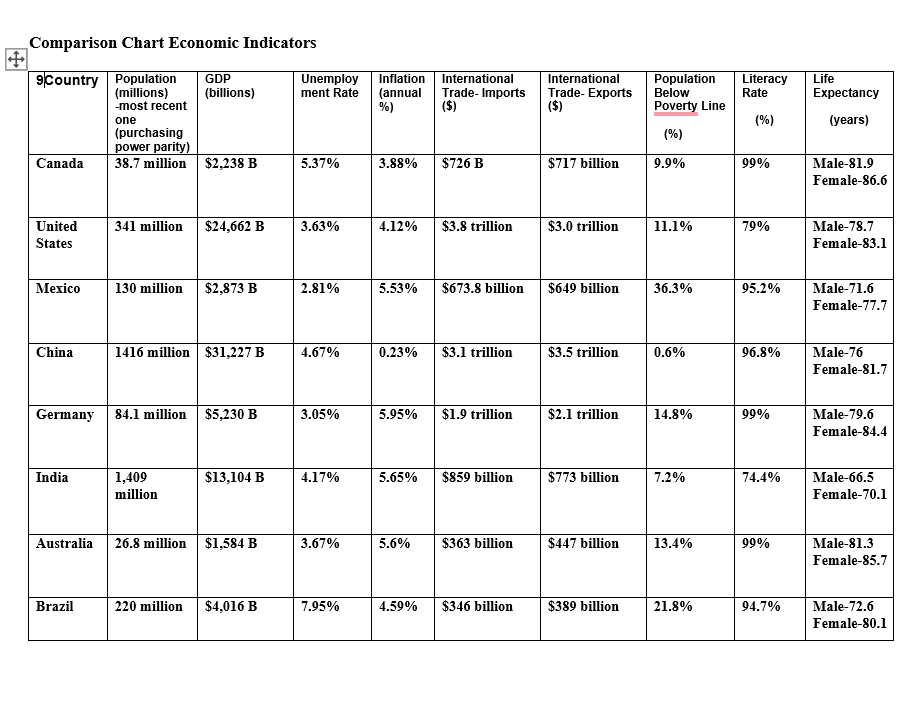
Question: Comparison Chart Economic Indicators begin { tabular } { | c | c | c | c | c | c | c |
Comparison Chart Economic Indicators
begintabularcccccccccc
hline Country & Population millionsmost recent one purchasing power parity & begintabularl
GDP
billions
endtabular & Unemploy ment Rate & Inflation annual & International Trade Imports $ & International TradeExports $ & begintabularl
Population
Below
Poverty Line
endtabular & begintabularl
Literacy
Rate
endtabular & begintabularl
Life
Expectancy
years
endtabular
hline Canada & million & $ B & & & $ B & $ billion & & & begintabularl
Male
Female
endtabular
hline begintabularl
United
States
endtabular & million & $ B & & & $ trillion & $ trillion & & & begintabularl
Male
Female
endtabular
hline Mexico & million & $ B & & & $ billion & $ billion & & & begintabularl
Male
Female
endtabular
hline China & million & $ B & & & $ trillion & $ trillion & & & begintabularl
Male
Female
endtabular
hline Germany & million & $ B & & & $ trillion & $ trillion & & & begintabularl
Male
Female
endtabular
hline India &
beginarrayl
hline
text million
endarray
& $ B & & & $ billion & $ billion & & & begintabularl
Male
Female
endtabular
hline Australia & million & $ B & & & $ billion & $ billion & & & begintabularl
Male
Female
endtabular
hline Brazil & million & $ B & & & $ billion & $ billion & & & begintabularl
Male
Female
endtabular
hline
endtabular
Step by Step Solution
There are 3 Steps involved in it
1 Expert Approved Answer
Step: 1 Unlock

Question Has Been Solved by an Expert!
Get step-by-step solutions from verified subject matter experts
Step: 2 Unlock
Step: 3 Unlock