

Question: Complete a ratio analysis for 2018, 2019, 2020 using the given data? Please show formulas. PROFITABILTY & SUSTAINABILITY Operating Margin Increase in unrestricted net assets/total
Complete a ratio analysis for 2018, 2019, 2020 using the given data? Please show formulas.
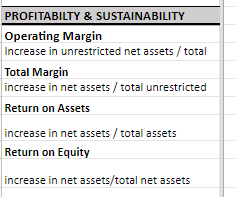
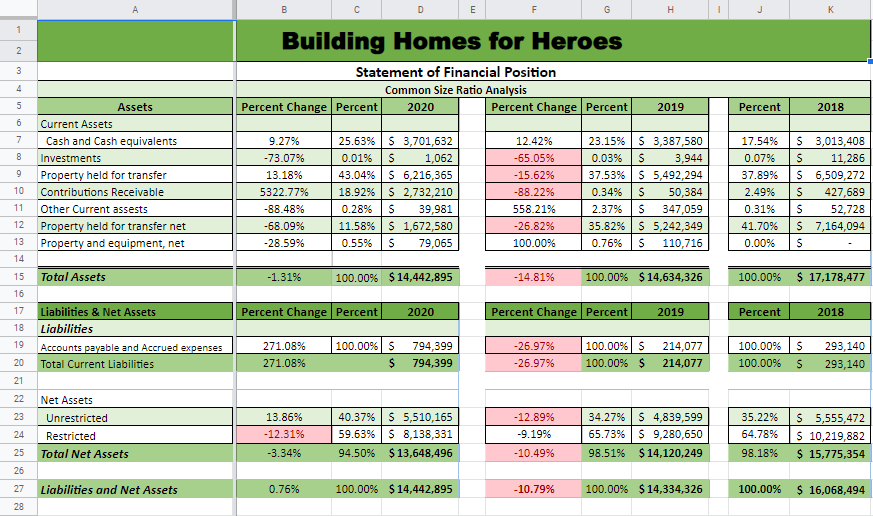
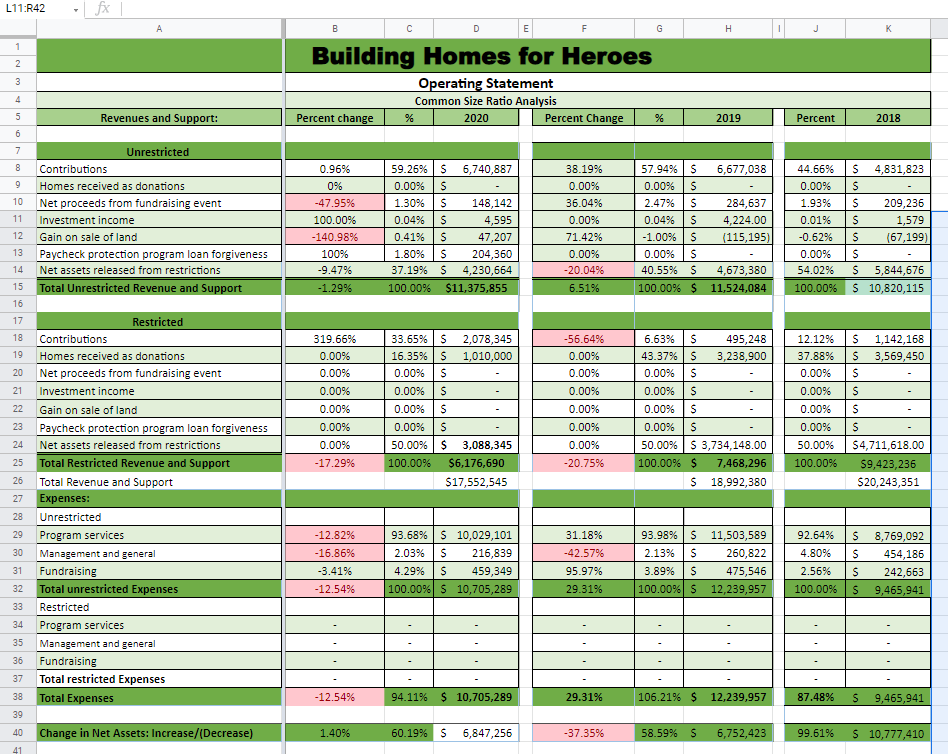
PROFITABILTY & SUSTAINABILITY Operating Margin Increase in unrestricted net assets/total Total Margin increase in net assets/total unrestricted Return on Assets increase in net assets/total assets Return on Equity increase in net assets/total net assets B E G H J 1 2 3 Building Homes for Heroes Statement of Financial Position Common Size Ratio Analysis Percent Change Percent Percent Change Percent 4 UN 5 2020 2019 Percent 2018 6 7 8 9 Assets Current Assets Cash and Cash equivalents Investments Property held for transfer Contributions Receivable Other Current assests Property held for transfer net Property and equipment, net 10 9.27% -73.07% 13.18% 5322.77% -88.48% -68.09% -28.59% 25.63% S 3,701,632 0.01% S 1,062 43.04%S 6,216,365 18.92% S 2,732,210 0.28% S 39,981 11.58% S 1,672,580 0.55% S 79,065 12.42% -65.05% - 15.62% -88.22% 558.21% -26.82% 100.00% 23.15% S 3,387,580 0.03% S 3,944 37.53% S 5,492,294 0.34% S 50,384 2.37% S 347,059 35.82% 5 5,242,349 0.76% S 110,716 17.54% 0.07% 37.89% 2.49% 0.31% 41.70% 0.00% S 3,013,408 S 11,286 S 6,509,272 S 427,689 S 52,728 S 7,164,094 S 11 12 13 Total Assets -1.31% 100.00% $ 14,442,895 -14.81% 14 15 16 17 100.00% $ 14,634,326 100.00% $ 17,178,477 Percent Change Percent 2020 Percent Change Percent 2019 Percent 2018 18 19 Liabilities & Net Assets Liabilities Accounts payable and Accrued expenses Total Current Liabilities S 271.08% 271.08% 100.00% S $ 794,399 794,399 -26.97% -26.97% 100.00% S 100.00% $ 214,077 214,077 100.00% 100.00% 293,140 293,140 20 S 21 22 23 Net Assets Unrestricted Restricted Total Net Assets 24 13.86% - 12.31% -3.34% 40.37% S 5,510,165 59.63% 5 8,138,331 94.50% $ 13,648,496 -12.89% -9.19% 34.27% S 4,839,599 65.73% S 9,280,650 98.51% $ 14,120,249 35.22% 64.78% 98.18% S 5,555,472 S 10,219,882 $ 15,775,354 25 -10.49% 26 27 Liabilities and Net Assets 0.76% 100.00% $ 14,442,895 -10.79% 100.00% $ 14,334,326 100.00% $ 16,068,494 28 L11:R42 - fx B E G H 1 2 3 Building Homes for Heroes Operating Statement Common Size Ratio Analysis Percent Change 4 5 Revenues and Support: Percent change 2020 % 2019 Percent 2018 6 7 8 9 10 11 Unrestricted Contributions Homes received as donations Net proceeds from fundraising event Investment income Gain on sale of land Paycheck protection program loan forgiveness Net assets released from restrictions Total Unrestricted Revenue and Support 0.96% 0% -47.95% 100.00% -140.98% 100% -9.47% -1.29% 59.26%S 6,740,887 0.00% S 1.30% S 148,142 0.04% S 4,595 0.41% S 47,207 1.80% S 204,360 37.19% S 4,230,664 100.00% $11,375,855 38.19% 0.00% 36.04% 0.00% 71.42% 0.00% -20.04% 6.51% 57.94% S 6,677,038 0.00% S 2.47% S 284,637 0.04% S 4,224.00 -1.00% S (115,195) 0.00% S 40.55% S 4,673,380 100.00% $ 11,524,084 44.66% 0.00% 1.93% 0.01% -0.62% 0.00% 54.02% 100.00% S 4,831,823 S S 209,236 S 1,579 S (67,199) S S 5,844,676 $ 10,820,115 12 13 14 15 16 17 18 19 -56.64% 0.00% 0.00% 0.00% 1,142,168 3,569,450 12.12% 37.88% 0.00% uuuu S S S 20 21 22 319.66% 0.00% 0.00% 0.00% 0.00% 0.00% 0.00% -17.29% 33.65% S 2,078,345 16.35% S 1,010,000 0.00% S 0.00% S 0.00% S 0.00% S 50.00% $ 3,088,345 100.00% $6,176,690 $17,552,545 6.63% 495,248 43.37% S 3,238,900 0.00% 0.00% 0.00% S 0.00% S 50.00%S 3,734,148.00 100.00% $ 7,468,296 $ 18,992,380 S S 0.00% 0.00% 0.00% 0.00% 50.00% 23 24 0.00% 0.00% -20.75% S $4,711,618.00 59,423,236 $20,243,351 25 100.00% 26 27 Restricted Contributions Homes received as donations Net proceeds from fundraising event Investment income Gain on sale of land Paycheck protection program loan forgiveness Net assets released from restrictions Total Restricted Revenue and Support Total Revenue and Support Expenses: Unrestricted Program services Management and general Fundraising Total unrestricted Expenses Restricted Program services Management and general Fundraising Total restricted Expenses Total Expenses 28 29 S S 30 -12.82% -16.86% -3.41% -12.54% 93.68% S 10,029,101 2.03% S 216,839 4.29% S 459,349 100.00% S 10,705,289 31.18% -42.57% 95.97% 29.31% 93.98%S 11,503,589 2.13% S 260,822 3.89% S 475,546 100.00% $ 12,239,957 92.64% 4.80% 2.56% 100.00% 8,769,092 454,186 242,663 9,465,941 31 32 S S 33 34 35 36 37 38 -12.54% 94.11% $ 10,705,289 29.31% 106.21% $ 12,239,957 87.48% S 9,465,941 39 40 Change in Net Assets: Increase/Decrease) 1.40% 60.19% S 6,847,256 -37.35% 58.59% S 6,752,423 99.61% $ 10,777,410 41 PROFITABILTY & SUSTAINABILITY Operating Margin Increase in unrestricted net assets/total Total Margin increase in net assets/total unrestricted Return on Assets increase in net assets/total assets Return on Equity increase in net assets/total net assets B E G H J 1 2 3 Building Homes for Heroes Statement of Financial Position Common Size Ratio Analysis Percent Change Percent Percent Change Percent 4 UN 5 2020 2019 Percent 2018 6 7 8 9 Assets Current Assets Cash and Cash equivalents Investments Property held for transfer Contributions Receivable Other Current assests Property held for transfer net Property and equipment, net 10 9.27% -73.07% 13.18% 5322.77% -88.48% -68.09% -28.59% 25.63% S 3,701,632 0.01% S 1,062 43.04%S 6,216,365 18.92% S 2,732,210 0.28% S 39,981 11.58% S 1,672,580 0.55% S 79,065 12.42% -65.05% - 15.62% -88.22% 558.21% -26.82% 100.00% 23.15% S 3,387,580 0.03% S 3,944 37.53% S 5,492,294 0.34% S 50,384 2.37% S 347,059 35.82% 5 5,242,349 0.76% S 110,716 17.54% 0.07% 37.89% 2.49% 0.31% 41.70% 0.00% S 3,013,408 S 11,286 S 6,509,272 S 427,689 S 52,728 S 7,164,094 S 11 12 13 Total Assets -1.31% 100.00% $ 14,442,895 -14.81% 14 15 16 17 100.00% $ 14,634,326 100.00% $ 17,178,477 Percent Change Percent 2020 Percent Change Percent 2019 Percent 2018 18 19 Liabilities & Net Assets Liabilities Accounts payable and Accrued expenses Total Current Liabilities S 271.08% 271.08% 100.00% S $ 794,399 794,399 -26.97% -26.97% 100.00% S 100.00% $ 214,077 214,077 100.00% 100.00% 293,140 293,140 20 S 21 22 23 Net Assets Unrestricted Restricted Total Net Assets 24 13.86% - 12.31% -3.34% 40.37% S 5,510,165 59.63% 5 8,138,331 94.50% $ 13,648,496 -12.89% -9.19% 34.27% S 4,839,599 65.73% S 9,280,650 98.51% $ 14,120,249 35.22% 64.78% 98.18% S 5,555,472 S 10,219,882 $ 15,775,354 25 -10.49% 26 27 Liabilities and Net Assets 0.76% 100.00% $ 14,442,895 -10.79% 100.00% $ 14,334,326 100.00% $ 16,068,494 28 L11:R42 - fx B E G H 1 2 3 Building Homes for Heroes Operating Statement Common Size Ratio Analysis Percent Change 4 5 Revenues and Support: Percent change 2020 % 2019 Percent 2018 6 7 8 9 10 11 Unrestricted Contributions Homes received as donations Net proceeds from fundraising event Investment income Gain on sale of land Paycheck protection program loan forgiveness Net assets released from restrictions Total Unrestricted Revenue and Support 0.96% 0% -47.95% 100.00% -140.98% 100% -9.47% -1.29% 59.26%S 6,740,887 0.00% S 1.30% S 148,142 0.04% S 4,595 0.41% S 47,207 1.80% S 204,360 37.19% S 4,230,664 100.00% $11,375,855 38.19% 0.00% 36.04% 0.00% 71.42% 0.00% -20.04% 6.51% 57.94% S 6,677,038 0.00% S 2.47% S 284,637 0.04% S 4,224.00 -1.00% S (115,195) 0.00% S 40.55% S 4,673,380 100.00% $ 11,524,084 44.66% 0.00% 1.93% 0.01% -0.62% 0.00% 54.02% 100.00% S 4,831,823 S S 209,236 S 1,579 S (67,199) S S 5,844,676 $ 10,820,115 12 13 14 15 16 17 18 19 -56.64% 0.00% 0.00% 0.00% 1,142,168 3,569,450 12.12% 37.88% 0.00% uuuu S S S 20 21 22 319.66% 0.00% 0.00% 0.00% 0.00% 0.00% 0.00% -17.29% 33.65% S 2,078,345 16.35% S 1,010,000 0.00% S 0.00% S 0.00% S 0.00% S 50.00% $ 3,088,345 100.00% $6,176,690 $17,552,545 6.63% 495,248 43.37% S 3,238,900 0.00% 0.00% 0.00% S 0.00% S 50.00%S 3,734,148.00 100.00% $ 7,468,296 $ 18,992,380 S S 0.00% 0.00% 0.00% 0.00% 50.00% 23 24 0.00% 0.00% -20.75% S $4,711,618.00 59,423,236 $20,243,351 25 100.00% 26 27 Restricted Contributions Homes received as donations Net proceeds from fundraising event Investment income Gain on sale of land Paycheck protection program loan forgiveness Net assets released from restrictions Total Restricted Revenue and Support Total Revenue and Support Expenses: Unrestricted Program services Management and general Fundraising Total unrestricted Expenses Restricted Program services Management and general Fundraising Total restricted Expenses Total Expenses 28 29 S S 30 -12.82% -16.86% -3.41% -12.54% 93.68% S 10,029,101 2.03% S 216,839 4.29% S 459,349 100.00% S 10,705,289 31.18% -42.57% 95.97% 29.31% 93.98%S 11,503,589 2.13% S 260,822 3.89% S 475,546 100.00% $ 12,239,957 92.64% 4.80% 2.56% 100.00% 8,769,092 454,186 242,663 9,465,941 31 32 S S 33 34 35 36 37 38 -12.54% 94.11% $ 10,705,289 29.31% 106.21% $ 12,239,957 87.48% S 9,465,941 39 40 Change in Net Assets: Increase/Decrease) 1.40% 60.19% S 6,847,256 -37.35% 58.59% S 6,752,423 99.61% $ 10,777,410 41
Step by Step Solution
There are 3 Steps involved in it

Get step-by-step solutions from verified subject matter experts