

Question: complete all requirements to answer this question Data table 2024 2023 Cash $ 60,000 $ 51,000 27,000 0 134,000 136,000 267,000 252,000 585,000 535,000 Short-term
 complete all requirements to answer this question
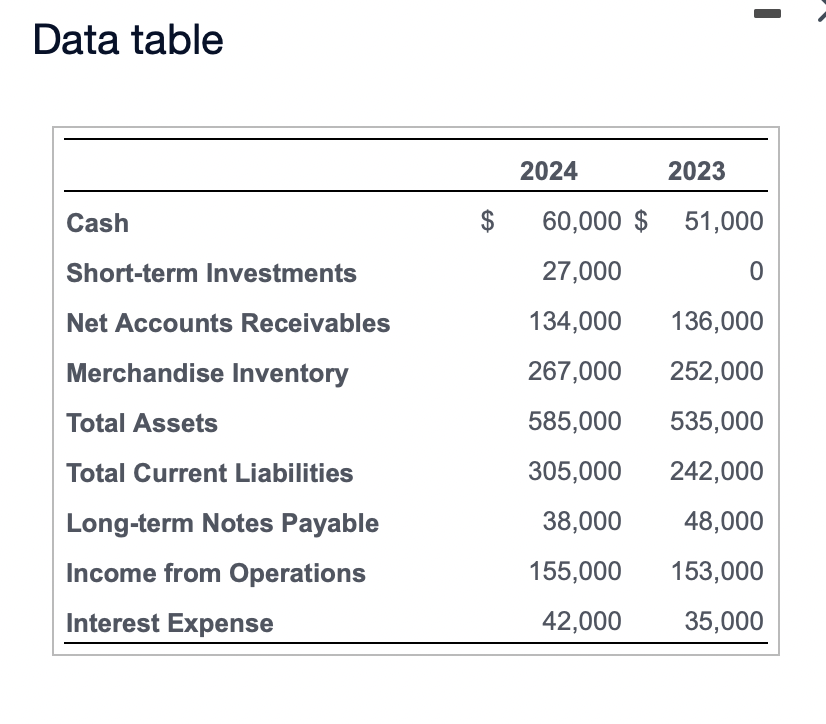
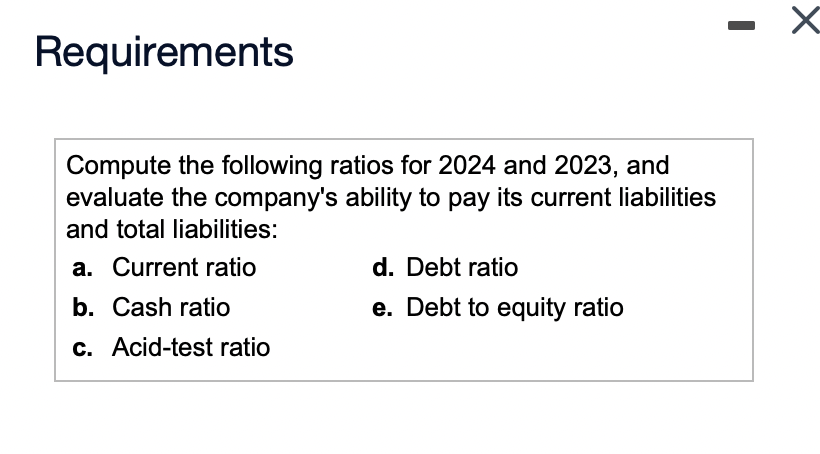
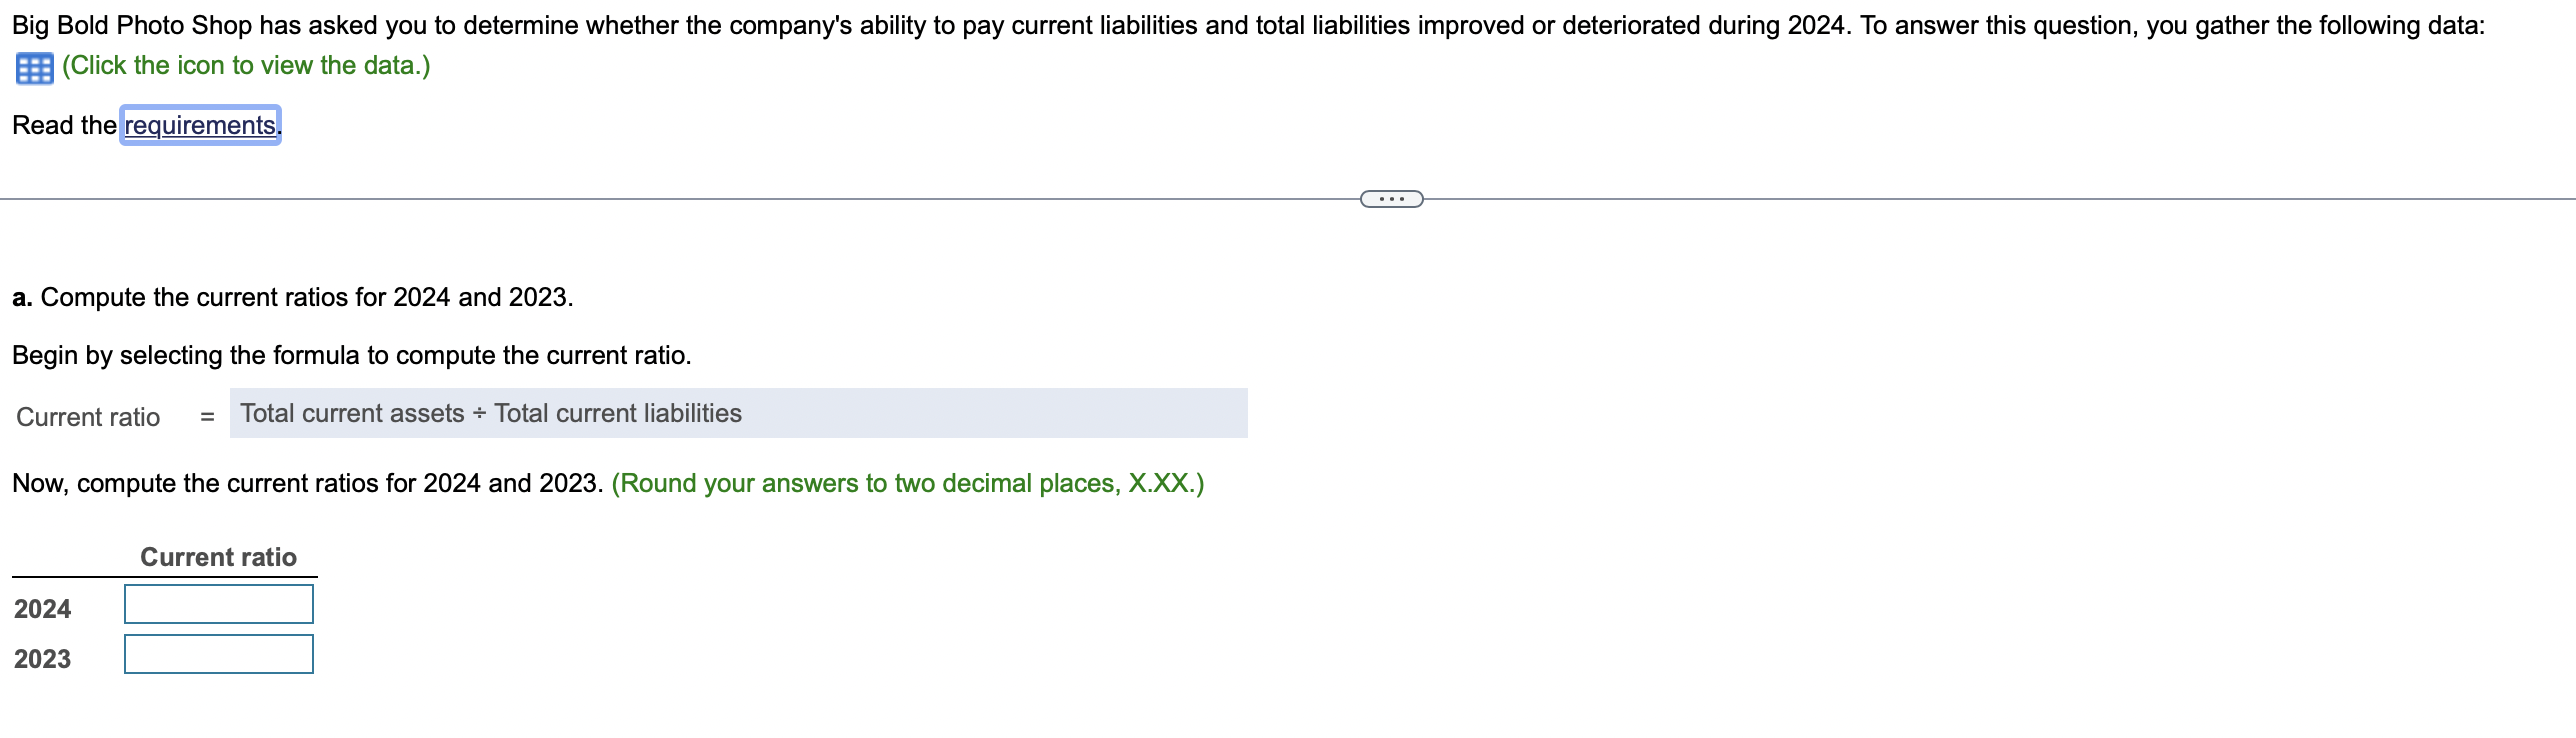
Data table 2024 2023 Cash $ 60,000 $ 51,000 27,000 0 134,000 136,000 267,000 252,000 585,000 535,000 Short-term Investments Net Accounts Receivables Merchandise Inventory Total Assets Total Current Liabilities Long-term Notes Payable Income from Operations Interest Expense 305,000 242,000 38,000 48,000 155,000 153,000 42,000 35,000 Requirements Compute the following ratios for 2024 and 2023, and evaluate the company's ability to pay its current liabilities and total liabilities: a. Current ratio d. Debt ratio b. Cash ratio e. Debt to equity ratio c. Acid-test ratio Big Bold Photo Shop has asked you to determine whether the company's ability to pay current liabilities and total liabilities improved or deteriorated during 2024. To answer this question, you gather the following data: B (Click the icon to view the data.) Read the requirements. a. Compute the current ratios for 2024 and 2023. Begin by selecting the formula to compute the current ratio. Current ratio = Total current assets - Total current liabilities Now, compute the current ratios for 2024 and 2023. (Round your answers to two decimal places, X.XX.) Current ratio 2024 2023
Step by Step Solution
There are 3 Steps involved in it

Get step-by-step solutions from verified subject matter experts