

Question: Complete an example job cost sheet using the best costing method. Job cost sheet is at the very bottom. Please fill out the job cost
Complete an example job cost sheet using the best costing method. Job cost sheet is at the very bottom. Please fill out the job cost sheet.
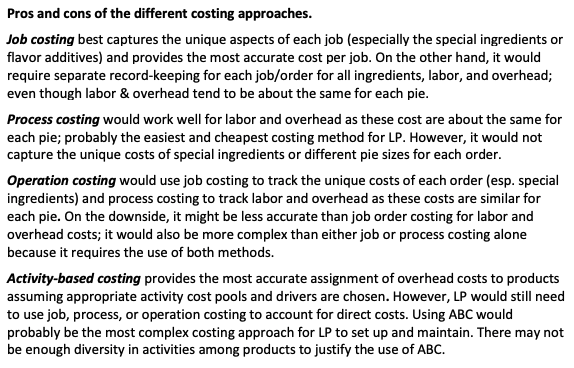
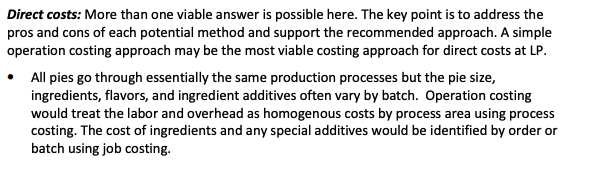
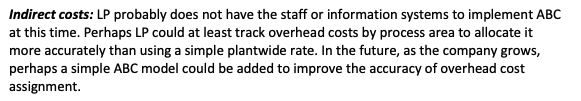
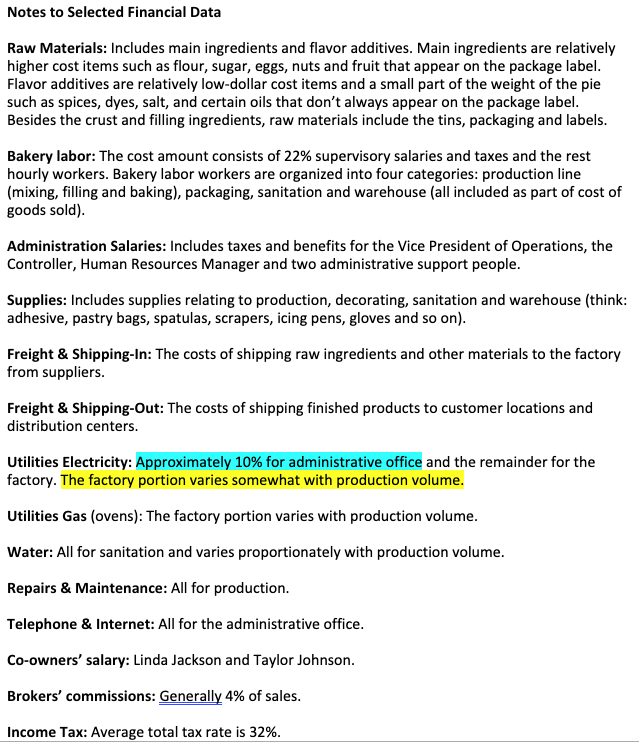
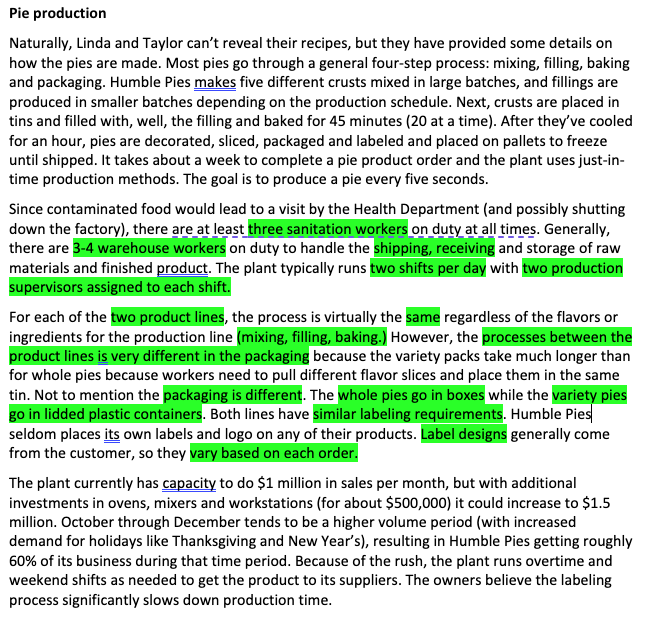
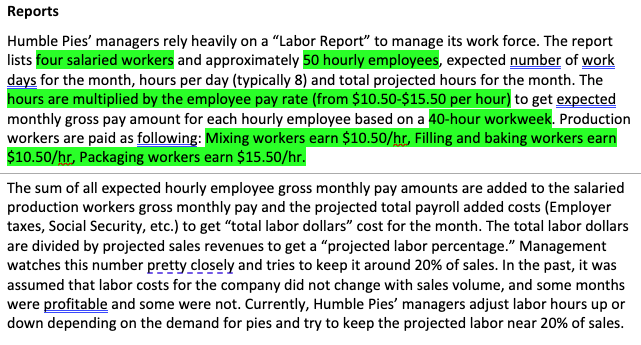
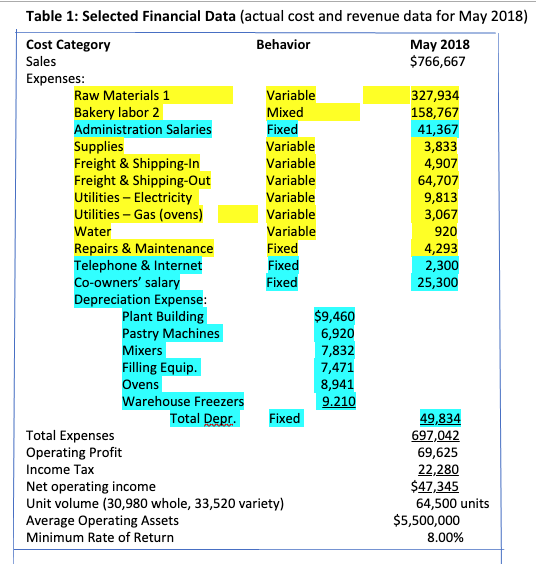
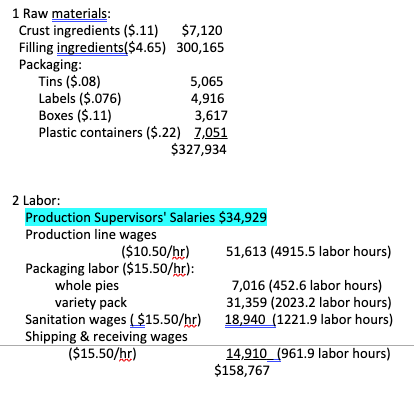
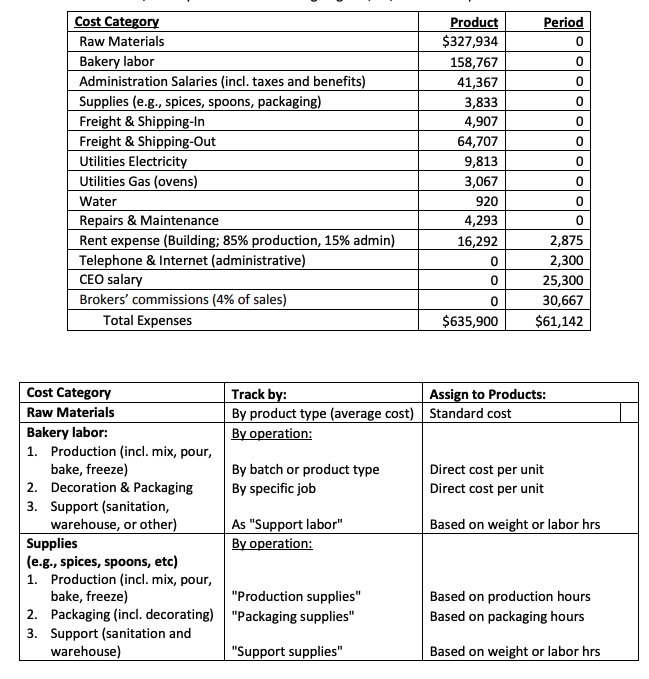
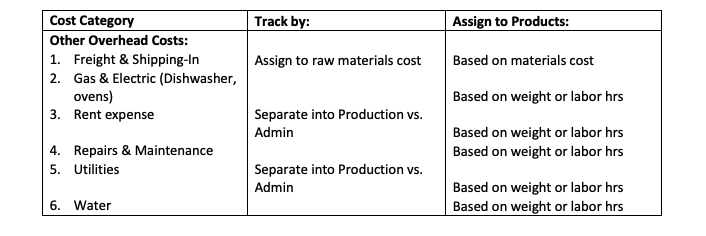
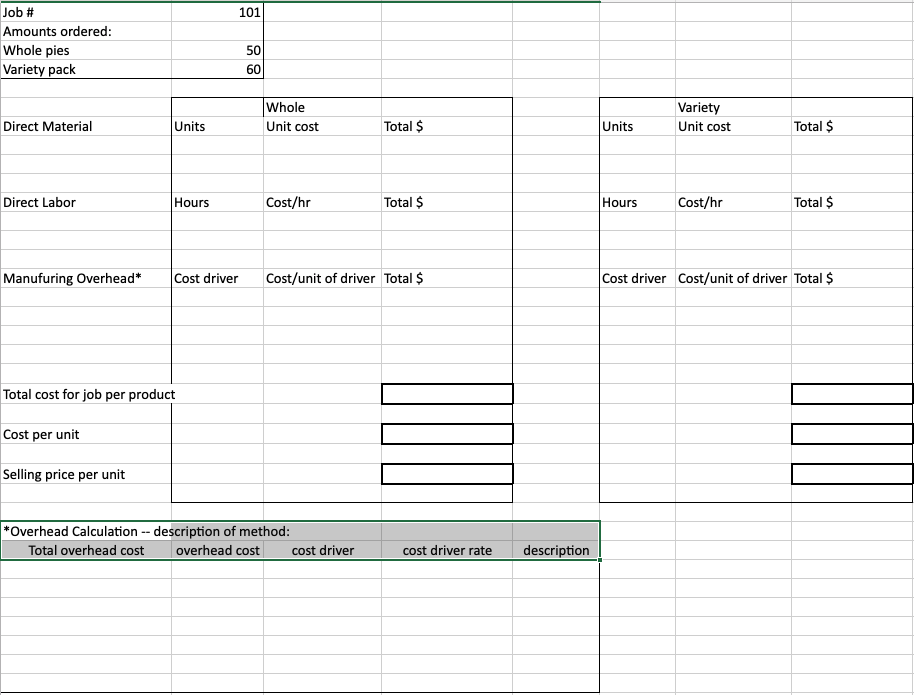
Pros and cons of the different costing approaches. Job costing best captures the unique aspects of each job (especially the special ingredients or flavor additives) and provides the most accurate cost per job. On the other hand, it would require separate record-keeping for each job/order for all ingredients, labor, and overhead; even though labor & overhead tend to be about the same for each pie. Process costing would work well for labor and overhead as these cost are about the same for each pie; probably the easiest and cheapest costing method for LP. However, it would not capture the unique costs of special ingredients or different pie sizes for each order. Operation costing would use job costing to track the unique costs of each order (esp. special ingredients) and process costing to track labor and overhead as these costs are similar for each pie. On the downside, it might be less accurate than job order costing for labor and overhead costs; it would also be more complex than either job or process costing alone because it requires the use of both methods. Activity-based costing provides the most accurate assignment of overhead costs to products assuming appropriate activity cost pools and drivers are chosen. However, LP would still need to use job, process, or operation costing to account for direct costs. Using ABC would probably be the most complex costing approach for LP to set up and maintain. There may not be enough diversity in activities among products to justify the use of ABC. Direct costs: More than one viable answer is possible here. The key point is to address the pros and cons of each potential method and support the recommended approach. A simple operation costing approach may be the most viable costing approach for direct costs at LP. All pies go through essentially the same production processes but the pie size, ingredients, flavors, and ingredient additives often vary by batch. Operation costing would treat the labor and overhead as homogenous costs by process area using process costing. The cost of ingredients and any special additives would be identified by order or batch using job costing. Indirect costs: LP probably does not have the staff or information systems to implement ABC at this time. Perhaps LP could at least track overhead costs by process area to allocate it more accurately than using a simple plantwide rate. In the future, as the company grows, perhaps a simple ABC model could be added to improve the accuracy of overhead cost assignment Notes to Selected Financial Data Raw Materials: Includes main ingredients and flavor additives. Main ingredients are relatively higher cost items such as flour, sugar, eggs, nuts and fruit that appear on the package label. Flavor additives are relatively low-dollar cost items and a small part of the weight of the pie such as spices, dyes, salt, and certain oils that don't always appear on the package label. Besides the crust and filling ingredients, raw materials include the tins, packaging and labels. Bakery labor: The cost amount consists of 22% supervisory salaries and taxes and the rest hourly workers. Bakery labor workers are organized into four categories: production line (mixing, filling and baking), packaging, sanitation and warehouse (all included as part of cost of goods sold). Administration Salaries: Includes taxes and benefits for the Vice President of Operations, the Controller, Human Resources Manager and two administrative support people. Supplies: Includes supplies relating to production, decorating, sanitation and warehouse (think: adhesive, pastry bags, spatulas, scrapers, icing pens, gloves and so on). Freight & Shipping-In: The costs of shipping raw ingredients and other materials to the factory from suppliers. Freight & Shipping-Out: The costs of shipping finished products to customer locations and distribution centers. Utilities Electricity: Approximately 10% for administrative office and the remainder for the factory. The factory portion varies somewhat with production volume. Utilities Gas (ovens): The factory portion varies with production volume. Water: All for sanitation and varies proportionately with production volume. Repairs & Maintenance: All for production. Telephone & Internet: All for the administrative office. Co-owners' salary: Linda Jackson and Taylor Johnson. Brokers' commissions: Generally 4% of sales. Income Tax: Average total tax rate is 32%. Pie production Naturally, Linda and Taylor can't reveal their recipes, but they have provided some details on how the pies are made. Most pies go through a general four-step process: mixing, filling, baking and packaging. Humble Pies makes five different crusts mixed in large batches, and fillings are produced in smaller batches depending on the production schedule. Next, crusts are placed in tins and filled with, well, the filling and baked for 45 minutes (20 at a time). After they've cooled for an hour, pies are decorated, sliced, packaged and labeled and placed on pallets to freeze until shipped. It takes about a week to complete a pie product order and the plant uses just-in- time production methods. The goal is to produce a pie every five seconds. Since contaminated food would lead to a visit by the Health Department (and possibly shutting down the factory), there are at least three sanitation workers on duty at all times. Generally, there are 3-4 warehouse workers on duty to handle the shipping, receiving and storage of raw materials and finished product. The plant typically runs two shifts per day with two production supervisors assigned to each shift. For each of the two product lines, the process is virtually the same regardless of the flavors or ingredients for the production line (mixing, filling, baking.) However, the processes between the product lines is very different in the packaging because the variety packs take much longer than for whole pies because workers need to pull different flavor slices and place them in the same tin. Not to mention the packaging is different. The whole pies go in boxes while the variety pies go in lidded plastic containers. Both lines have similar labeling requirements. Humble Pies seldom places its own labels and logo on any of their products. Label designs generally come from the customer, so they vary based on each order. The plant currently has capacity to do $1 million in sales per month, but with additional investments in ovens, mixers and workstations (for about $500,000) it could increase to $1.5 million. October through December tends to be a higher volume period (with increased demand for holidays like Thanksgiving and New Year's), resulting in Humble Pies getting roughly 60% of its business during that time period. Because of the rush, the plant runs overtime and weekend shifts as needed to get the product to its suppliers. The owners believe the labeling process significantly slows down production time. Reports Humble Pies' managers rely heavily on a "Labor Report to manage its work force. The report lists four salaried workers and approximately 50 hourly employees, expected number of work days for the month, hours per day (typically 8) and total projected hours for the month. The hours are multiplied by the employee pay rate (from $10.50-$15.50 per hour) to get expected monthly gross pay amount for each hourly employee based on a 40-hour workweek. Production workers are paid as following: Mixing workers earn $10.50/hr, Filling and baking workers earn $10.50/hr, Packaging workers earn $15.50/hr. The sum of all expected hourly employee gross monthly pay amounts are added to the salaried production workers gross monthly pay and the projected total payroll added costs (Employer taxes, Social Security, etc.) to get "total labor dollars cost for the month. The total labor dollars are divided by projected sales revenues to get a projected labor percentage. Management watches this number pretty closely and tries to keep it around 20% of sales. In the past, it was assumed that labor costs for the company did not change with sales volume, and some months were profitable and some were not. Currently, Humble Pies' managers adjust labor hours up or down depending on the demand for pies and try to keep the projected labor near 20% of sales. Table 1: Selected Financial Data (actual cost and revenue data for May 2018) Cost Category Behavior May 2018 Sales $766,667 Expenses: Raw Materials 1 Variable 327,934 Bakery labor 2 Mixed 158,767 Administration Salaries Fixed 41,367 Supplies Variable 3,833 Freight & Shipping-In Variable 4,907 Freight & Shipping-Out Variable 64,707 Utilities - Electricity Variable 9,813 Utilities - Gas (ovens) Variable 3,067 Water Variable 920 Repairs & Maintenance Fixed 4,293 Telephone & Internet Fixed 2,300 Co-owners' salary Fixed 25,300 Depreciation Expense: Plant Building $9,460 Pastry Machines 6,920 Mixers 7,832 Filling Equip. 7,471 Ovens 8,941 Warehouse Freezers 9.210 Total Depr Fixed 49,834 Total Expenses 697,042 Operating Profit 69,625 Income Tax 22,280 Net operating income $47,345 Unit volume (30,980 whole, 33,520 variety) 64,500 units Average Operating Assets $5,500,000 Minimum Rate of Return 8.00% 1 Raw materials: Crust ingredients ($.11) $7,120 Filling ingredients($4.65) 300,165 Packaging: Tins (5.08) 5,065 Labels ($.076) 4,916 Boxes ($.11) 3,617 Plastic containers ($.22) 7,051 $327,934 2 Labor: Production Supervisors' Salaries $34,929 Production line wages ($10.50/hr) 51,613 (4915.5 labor hours) Packaging labor ($15.50/hr): whole pies 7,016 (452.6 labor hours) variety pack 31,359 (2023.2 labor hours) Sanitation wages ( $15.50/hr) 18,940 (1221.9 labor hours) Shipping & receiving wages ($15.50/hr) 14,910_1961.9 labor hours) $158,767 Period 0 0 0 0 0 Product $327,934 158,767 41,367 3,833 4,907 64,707 9,813 3,067 920 4,293 16,292 0 0 Cost Category Raw Materials Bakery labor Administration Salaries (incl. taxes and benefits) Supplies (e.g., spices, spoons, packaging) Freight & Shipping-In Freight & Shipping-Out Utilities Electricity Utilities Gas (ovens) Water Repairs & Maintenance Rent expense (Building; 85% production, 15% admin) Telephone & Internet (administrative) CEO salary Brokers' commissions (4% of sales) Total Expenses 0 0 0 0 2,875 2,300 25,300 30,667 $61,142 0 0 $635,900 Cost Category Track by: Assign to Products: Raw Materials By product type (average cost) Standard cost Bakery labor: By operation: 1. Production (incl. mix, pour, bake, freeze) By batch or product type Direct cost per unit 2. Decoration & Packaging By specific job Direct cost per unit 3. Support (sanitation, warehouse, or other) As "Support labor" Based on weight or labor hrs Supplies By operation: (e.g., spices, spoons, etc) 1. Production (incl. mix, pour, bake, freeze) "Production supplies" Based on production hours 2. Packaging (incl. decorating) "Packaging supplies" Based on packaging hours 3. Support (sanitation and warehouse) "Support supplies" Based on weight or labor hrs Track by: Assign to Products: Cost Category Other Overhead Costs: 1. Freight & Shipping-In 2. Gas & Electric (Dishwasher, ovens) 3. Rent expense Assign to raw materials cost Based on materials cost Based on weight or labor hrs Separate into Production vs. Admin 4. Repairs & Maintenance 5. Utilities Based on weight or labor hrs Based on weight or labor hrs Separate into Production vs. Admin Based on weight or labor hrs Based on weight or labor hrs 6. Water 101 Job # Amounts ordered: Whole pies Variety pack 50 60 Whole Variety Unit cost Direct Material Units Unit cost Total $ Units Total $ Direct Labor Hours Cost/hr Total $ Hours Cost/hr Total $ Manufuring Overhead* Cost driver Cost/unit of driver Total $ Cost driver Cost/unit of driver Total $ Total cost for job per product Cost per unit Selling price per unit *Overhead Calculation -- description of method: Total overhead cost overhead cost cost driver cost driver rate description Pros and cons of the different costing approaches. Job costing best captures the unique aspects of each job (especially the special ingredients or flavor additives) and provides the most accurate cost per job. On the other hand, it would require separate record-keeping for each job/order for all ingredients, labor, and overhead; even though labor & overhead tend to be about the same for each pie. Process costing would work well for labor and overhead as these cost are about the same for each pie; probably the easiest and cheapest costing method for LP. However, it would not capture the unique costs of special ingredients or different pie sizes for each order. Operation costing would use job costing to track the unique costs of each order (esp. special ingredients) and process costing to track labor and overhead as these costs are similar for each pie. On the downside, it might be less accurate than job order costing for labor and overhead costs; it would also be more complex than either job or process costing alone because it requires the use of both methods. Activity-based costing provides the most accurate assignment of overhead costs to products assuming appropriate activity cost pools and drivers are chosen. However, LP would still need to use job, process, or operation costing to account for direct costs. Using ABC would probably be the most complex costing approach for LP to set up and maintain. There may not be enough diversity in activities among products to justify the use of ABC. Direct costs: More than one viable answer is possible here. The key point is to address the pros and cons of each potential method and support the recommended approach. A simple operation costing approach may be the most viable costing approach for direct costs at LP. All pies go through essentially the same production processes but the pie size, ingredients, flavors, and ingredient additives often vary by batch. Operation costing would treat the labor and overhead as homogenous costs by process area using process costing. The cost of ingredients and any special additives would be identified by order or batch using job costing. Indirect costs: LP probably does not have the staff or information systems to implement ABC at this time. Perhaps LP could at least track overhead costs by process area to allocate it more accurately than using a simple plantwide rate. In the future, as the company grows, perhaps a simple ABC model could be added to improve the accuracy of overhead cost assignment Notes to Selected Financial Data Raw Materials: Includes main ingredients and flavor additives. Main ingredients are relatively higher cost items such as flour, sugar, eggs, nuts and fruit that appear on the package label. Flavor additives are relatively low-dollar cost items and a small part of the weight of the pie such as spices, dyes, salt, and certain oils that don't always appear on the package label. Besides the crust and filling ingredients, raw materials include the tins, packaging and labels. Bakery labor: The cost amount consists of 22% supervisory salaries and taxes and the rest hourly workers. Bakery labor workers are organized into four categories: production line (mixing, filling and baking), packaging, sanitation and warehouse (all included as part of cost of goods sold). Administration Salaries: Includes taxes and benefits for the Vice President of Operations, the Controller, Human Resources Manager and two administrative support people. Supplies: Includes supplies relating to production, decorating, sanitation and warehouse (think: adhesive, pastry bags, spatulas, scrapers, icing pens, gloves and so on). Freight & Shipping-In: The costs of shipping raw ingredients and other materials to the factory from suppliers. Freight & Shipping-Out: The costs of shipping finished products to customer locations and distribution centers. Utilities Electricity: Approximately 10% for administrative office and the remainder for the factory. The factory portion varies somewhat with production volume. Utilities Gas (ovens): The factory portion varies with production volume. Water: All for sanitation and varies proportionately with production volume. Repairs & Maintenance: All for production. Telephone & Internet: All for the administrative office. Co-owners' salary: Linda Jackson and Taylor Johnson. Brokers' commissions: Generally 4% of sales. Income Tax: Average total tax rate is 32%. Pie production Naturally, Linda and Taylor can't reveal their recipes, but they have provided some details on how the pies are made. Most pies go through a general four-step process: mixing, filling, baking and packaging. Humble Pies makes five different crusts mixed in large batches, and fillings are produced in smaller batches depending on the production schedule. Next, crusts are placed in tins and filled with, well, the filling and baked for 45 minutes (20 at a time). After they've cooled for an hour, pies are decorated, sliced, packaged and labeled and placed on pallets to freeze until shipped. It takes about a week to complete a pie product order and the plant uses just-in- time production methods. The goal is to produce a pie every five seconds. Since contaminated food would lead to a visit by the Health Department (and possibly shutting down the factory), there are at least three sanitation workers on duty at all times. Generally, there are 3-4 warehouse workers on duty to handle the shipping, receiving and storage of raw materials and finished product. The plant typically runs two shifts per day with two production supervisors assigned to each shift. For each of the two product lines, the process is virtually the same regardless of the flavors or ingredients for the production line (mixing, filling, baking.) However, the processes between the product lines is very different in the packaging because the variety packs take much longer than for whole pies because workers need to pull different flavor slices and place them in the same tin. Not to mention the packaging is different. The whole pies go in boxes while the variety pies go in lidded plastic containers. Both lines have similar labeling requirements. Humble Pies seldom places its own labels and logo on any of their products. Label designs generally come from the customer, so they vary based on each order. The plant currently has capacity to do $1 million in sales per month, but with additional investments in ovens, mixers and workstations (for about $500,000) it could increase to $1.5 million. October through December tends to be a higher volume period (with increased demand for holidays like Thanksgiving and New Year's), resulting in Humble Pies getting roughly 60% of its business during that time period. Because of the rush, the plant runs overtime and weekend shifts as needed to get the product to its suppliers. The owners believe the labeling process significantly slows down production time. Reports Humble Pies' managers rely heavily on a "Labor Report to manage its work force. The report lists four salaried workers and approximately 50 hourly employees, expected number of work days for the month, hours per day (typically 8) and total projected hours for the month. The hours are multiplied by the employee pay rate (from $10.50-$15.50 per hour) to get expected monthly gross pay amount for each hourly employee based on a 40-hour workweek. Production workers are paid as following: Mixing workers earn $10.50/hr, Filling and baking workers earn $10.50/hr, Packaging workers earn $15.50/hr. The sum of all expected hourly employee gross monthly pay amounts are added to the salaried production workers gross monthly pay and the projected total payroll added costs (Employer taxes, Social Security, etc.) to get "total labor dollars cost for the month. The total labor dollars are divided by projected sales revenues to get a projected labor percentage. Management watches this number pretty closely and tries to keep it around 20% of sales. In the past, it was assumed that labor costs for the company did not change with sales volume, and some months were profitable and some were not. Currently, Humble Pies' managers adjust labor hours up or down depending on the demand for pies and try to keep the projected labor near 20% of sales. Table 1: Selected Financial Data (actual cost and revenue data for May 2018) Cost Category Behavior May 2018 Sales $766,667 Expenses: Raw Materials 1 Variable 327,934 Bakery labor 2 Mixed 158,767 Administration Salaries Fixed 41,367 Supplies Variable 3,833 Freight & Shipping-In Variable 4,907 Freight & Shipping-Out Variable 64,707 Utilities - Electricity Variable 9,813 Utilities - Gas (ovens) Variable 3,067 Water Variable 920 Repairs & Maintenance Fixed 4,293 Telephone & Internet Fixed 2,300 Co-owners' salary Fixed 25,300 Depreciation Expense: Plant Building $9,460 Pastry Machines 6,920 Mixers 7,832 Filling Equip. 7,471 Ovens 8,941 Warehouse Freezers 9.210 Total Depr Fixed 49,834 Total Expenses 697,042 Operating Profit 69,625 Income Tax 22,280 Net operating income $47,345 Unit volume (30,980 whole, 33,520 variety) 64,500 units Average Operating Assets $5,500,000 Minimum Rate of Return 8.00% 1 Raw materials: Crust ingredients ($.11) $7,120 Filling ingredients($4.65) 300,165 Packaging: Tins (5.08) 5,065 Labels ($.076) 4,916 Boxes ($.11) 3,617 Plastic containers ($.22) 7,051 $327,934 2 Labor: Production Supervisors' Salaries $34,929 Production line wages ($10.50/hr) 51,613 (4915.5 labor hours) Packaging labor ($15.50/hr): whole pies 7,016 (452.6 labor hours) variety pack 31,359 (2023.2 labor hours) Sanitation wages ( $15.50/hr) 18,940 (1221.9 labor hours) Shipping & receiving wages ($15.50/hr) 14,910_1961.9 labor hours) $158,767 Period 0 0 0 0 0 Product $327,934 158,767 41,367 3,833 4,907 64,707 9,813 3,067 920 4,293 16,292 0 0 Cost Category Raw Materials Bakery labor Administration Salaries (incl. taxes and benefits) Supplies (e.g., spices, spoons, packaging) Freight & Shipping-In Freight & Shipping-Out Utilities Electricity Utilities Gas (ovens) Water Repairs & Maintenance Rent expense (Building; 85% production, 15% admin) Telephone & Internet (administrative) CEO salary Brokers' commissions (4% of sales) Total Expenses 0 0 0 0 2,875 2,300 25,300 30,667 $61,142 0 0 $635,900 Cost Category Track by: Assign to Products: Raw Materials By product type (average cost) Standard cost Bakery labor: By operation: 1. Production (incl. mix, pour, bake, freeze) By batch or product type Direct cost per unit 2. Decoration & Packaging By specific job Direct cost per unit 3. Support (sanitation, warehouse, or other) As "Support labor" Based on weight or labor hrs Supplies By operation: (e.g., spices, spoons, etc) 1. Production (incl. mix, pour, bake, freeze) "Production supplies" Based on production hours 2. Packaging (incl. decorating) "Packaging supplies" Based on packaging hours 3. Support (sanitation and warehouse) "Support supplies" Based on weight or labor hrs Track by: Assign to Products: Cost Category Other Overhead Costs: 1. Freight & Shipping-In 2. Gas & Electric (Dishwasher, ovens) 3. Rent expense Assign to raw materials cost Based on materials cost Based on weight or labor hrs Separate into Production vs. Admin 4. Repairs & Maintenance 5. Utilities Based on weight or labor hrs Based on weight or labor hrs Separate into Production vs. Admin Based on weight or labor hrs Based on weight or labor hrs 6. Water 101 Job # Amounts ordered: Whole pies Variety pack 50 60 Whole Variety Unit cost Direct Material Units Unit cost Total $ Units Total $ Direct Labor Hours Cost/hr Total $ Hours Cost/hr Total $ Manufuring Overhead* Cost driver Cost/unit of driver Total $ Cost driver Cost/unit of driver Total $ Total cost for job per product Cost per unit Selling price per unit *Overhead Calculation -- description of method: Total overhead cost overhead cost cost driver cost driver rate description
Step by Step Solution
There are 3 Steps involved in it

Get step-by-step solutions from verified subject matter experts