

Question: Complete analysis C D E F G 10 puntos Completar el income statement Income Statement 20x5 Revenue Cost of Goods Sold Gross profits Sales and
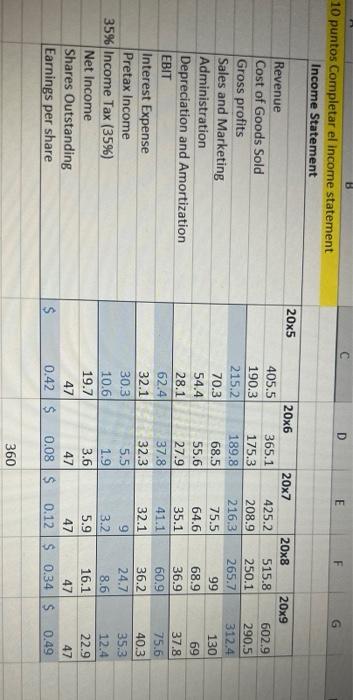
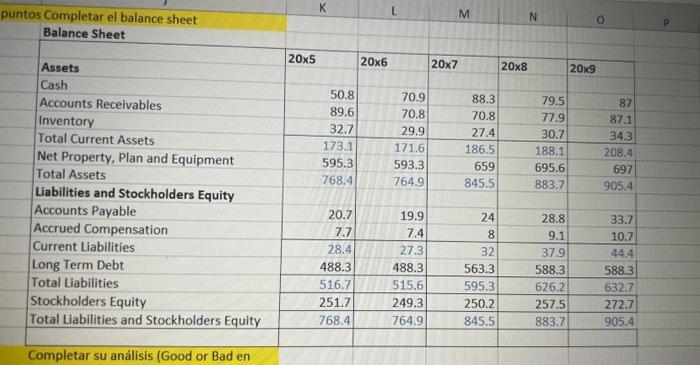
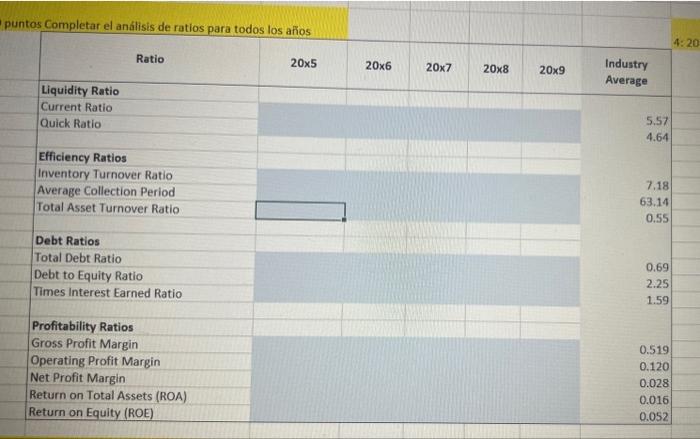
C D E F G 10 puntos Completar el income statement Income Statement 20x5 Revenue Cost of Goods Sold Gross profits Sales and Marketing Administration Depreciation and Amortization EBIT Interest Expense Pretax Income 35% Income Tax (359) Net Income Shares Outstanding Earnings per share 20x6 20x7 20x8 20x9 405,5 365.1 425.2 515.8 602.9 190.3 175.3 208.9 250.1 290.5 215.2 189.8 216,3 265.7 312.4 70.3 68.5 75.5 99 130 54.4 55.6 64.6 68.9 69 28.1 27.9 35.1 36.9 37.8 62.4 37.8 41.1 60.9 75,6 32.1 32.3 32.1 36.2 40.3 30.3 5.5 9 24.7 35.3 10.6 1.9 3.2 8.6 12.4 19.7 3.6 5.9 16.1 22.9 47 47 47 47 47 0.42 $ 0.08 $ 0.12 S 0.34 $ 0.49 $ 360 M N puntos Completar el balance sheet Balance Sheet o 20x5 20x6 20x7 20x8 20x9 50.8 89.6 32.7 173.1 595.3 768.4 70.9 70.8 29.9 171.6 593.3 764.9 88.3 70.8 27.4 186.5 659 845.5 79.5 77.9 30.7 188.1 695.6 883.7 87 87.1 34.3 208.4 697 905.4 Assets Cash Accounts Receivables Inventory Total Current Assets Net Property, Plan and Equipment Total Assets Liabilities and Stockholders Equity Accounts Payable Accrued Compensation Current Liabilities Long Term Debt Total Liabilities Stockholders Equity Total Liabilities and Stockholders Equity 20.7 7.7 28.4 488.3 516.7 251.7 768.4 19.9 7.4 27.3 488.3 515.6 249.3 764.9 24 8 32 563.3 595.3 250.2 845,5 28.8 9.1 37.9 588.3 626.2 257.5 883.7 33.7 10.7 44.4 588.3 632.7 272.7 905.4 Completar su anlisis (Good or Bad en puntos Completar el anlisis de ratios para todos los aos 4:20 Ratio 20x5 20x6 20x7 20x8 20x9 Industry Average Liquidity Ratio Current Ratio Quick Ratio 5.57 4.64 Efficiency Ratios Inventory Turnover Ratio Average Collection Period Total Asset Turnover Ratio 7.18 63.14 0.55 Debt Ratios Total Debt Ratio Debt to Equity Ratio Times Interest Earned Ratio 0.69 2.25 1.59 Profitability Ratios Gross Profit Margin Operating Profit Margin Net Profit Margin Return on Total Assets (ROA) Return on Equity (ROE) 0.519 0.120 0.028 0.016 0.052
Step by Step Solution
There are 3 Steps involved in it

Get step-by-step solutions from verified subject matter experts