

Question: complete excel spreadsheet using data in case study 4 A 8 c D E F G Calculations Lifetime Value Tuscan Lifestyles: Initial order $50 1
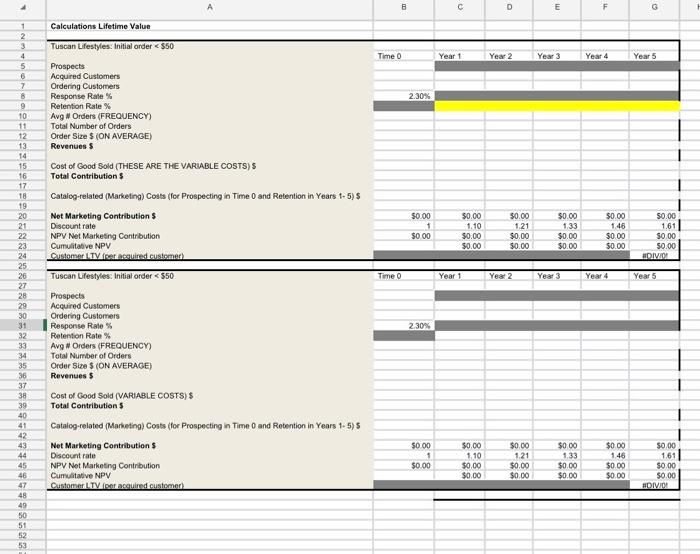
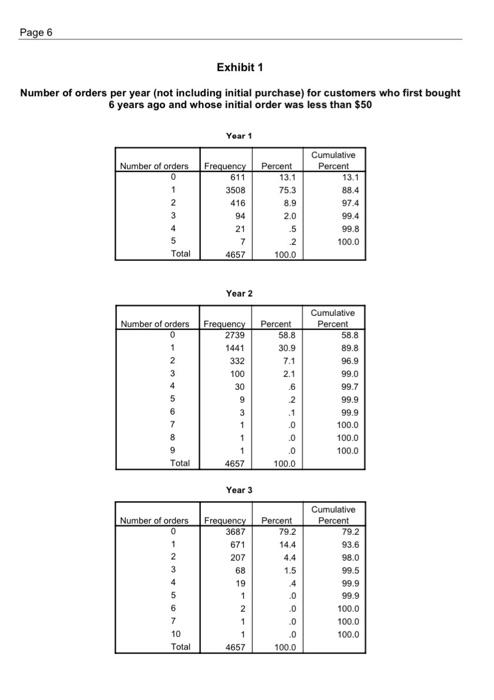
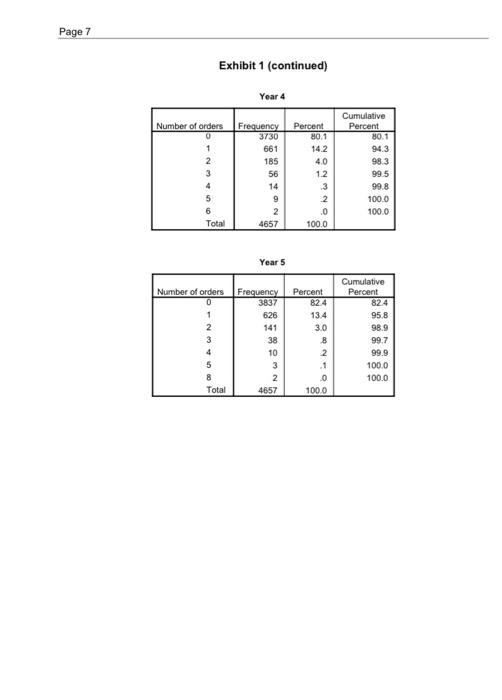
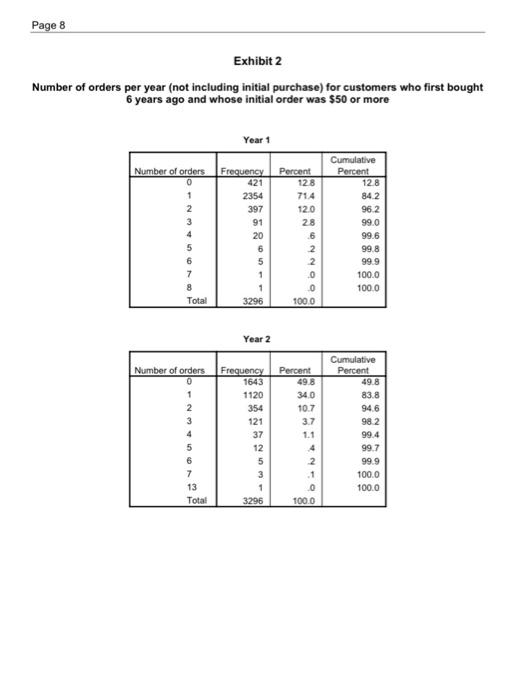
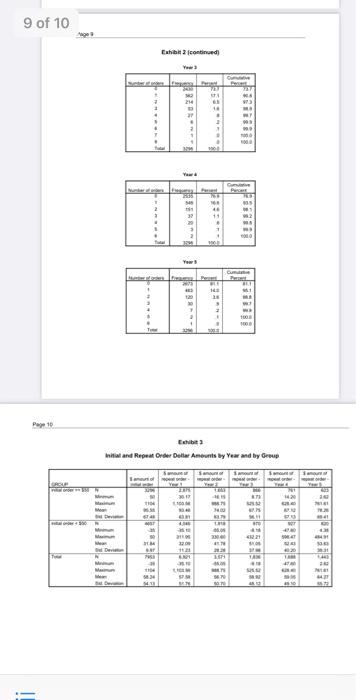
4 A 8 c D E F G Calculations Lifetime Value Tuscan Lifestyles: Initial order $50 1 2 3 4 5 6 7 Timeo Year 1 Year 2 Year 3 Year 4 Year 5 2.30% Prospects Acquired Customers Ordering Customers Response Rale % Retention Rate % Avg # Orders (FREQUENCY) Total Number of Orders Order Size S (ON AVERAGE) Revenues 5 Cost of Good Sold (THESE ARE THE VARIABLE COSTS) Total Contribution Catalog-related (Marketing Costs (for Prospecting in Time 0 and Retention in Years 1-5}$ Net Marketing Contributions Discount rate NPV Net Marketing Contribution Cumulative NPV Customer I TV Industomer 50.00 1 $0.00 50.00 1.10 $0.00 $0.00 50.00 1.21 $0.00 50.00 50.00 1.33 $0.00 $0.00 $0.00 1.46 $0.00 50.00 $0.00 1.61 $0.00 50.00 DIVO Tuscan Lifestyles: Initial order $50 Time 0 Year 1 Year 2 Year 3 Year 4 Year 5 9 10 11 12 13 14 15 16 17 18 19 20 21 22 23 24 25 26 27 28 29 30 31 32 33 34 35 36 37 38 39 40 41 42 43 44 45 46 47 48 49 50 2.30% Prospects Acquired Customers Ordering Customers Response Rates Retention Rate % Avg# Orders (FREQUENCY) Total Number of Orders Order Size S (ON AVERAGE) Revenues 5 Cost of Good Sold (VARIABLE COSTS) Total Contribution Catalog-related (Marketing Costs (for Prospecting in Time O and Retention in Years 1-5) Net Marketing Contributions Discount rate NPV Net Marketing Contribution Cumulative NPV Customer LTV.per acquired customer $0.00 1 $0.00 $0.00 1.10 $0.00 $0.00 $0.00 121 $0.00 $0.00 $0 00 1.33 $0.00 $0.00 $0 00 1.46 $0.00 $0.00 $0.00 1.61 $0.00 $0.00 BDIV 52 53 ITALY Tuscan Lifestyles: Assessing Customer Lifetime Value Marketers ... have assembled vast databases identifying their customers and their buying habits. With such information, companies now believe it's as important to reach the right people as it is to reach lots of people. - Business Week. September 23, 1991 It was late one afternoon in February and Joan Beckman was finishing her first month as marketing director for the Tuscan Lifestyles catalog. In a market environment increasingly cluttered with catalogs, one of her top priorities is to begin to use their database of customer Information. She is certain that the accumulated purchase history of their customers can be used to increase the effectiveness and efficiency of future marketing expenditures. The Tuscan Lifestyles catalog markets cookware, tableware, linens, and decorative home accessories - all in a style reflective of the Tuscany region in Italy. The catalog has been in business for nearly nine years and has gradually increased its customer base. Tuscan Lifestyles marketing approach has been primarily product-focused with the goal of building a solid base of popular, 'staple' items which are complemented by a changing assortment of both seasonal and trendier items. Like other catalogs, and retail businesses in general, Tuscan Lifestyles seeks cost- effective ways to find and retain a loyal customer base. Many of the items in the catalog are This case was produced by Professor Charlotte Mason of the University of North Carolina at Chapel Hil. This case serves to provide material for class discussion rather than to illustrate either effective or ineffective handling of a business situation. Names and data have been disguised to assure confidentiality. The assistance of the Direct Marketing Educational Foundation in supplying the data used for this case is gratefully acknowledged. The case is distributed by the Teradata Center for Customer Relationship Management at Duke University No part of this publication may be reproduced, stored in a retrieval system. used in a spread sheet, or transmitted in any form or by any means -electronic, mechanical, photocopying, recording or otherwise-without the permission of Charlotte Mason Page 2 exclusive and the limited data that Tuscan Lifestyles has indicates high levels of customer satisfaction. Nevertheless, like many other specialty catalog or retail businesses, Tuscan Lifestyles has many customers who make just one or two purchases in their 'life as a Tuscan Lifestyles customer. Given the nature of their products and their business, it is difficult for Tuscan Lifestyles to know whether or when a customer will make additional purchases. A customer may purchase a set of hand-painted dessert plates - and make no additional purchase for several years, but then order a full set of table linens. Another customer may make an initial purchase, followed in quick succession by two additional purchases - and then never be heard from again. While Tuscan Lifestyles can track the past purchasing history of their customers, there is no way to know when a customer stops being a customer. In contrast to businesses such as banks, telephone service or insurance, customers don't notify Tuscan Lifestyles when they stop being a customer. Instead, they just silently attrite. Finding New Customers Since it is not uncommon for a catalog to lose' half or even more of its customers from one year to the next, Tuscan Lifestyles is continually prospecting for new customers. Prospects are consumers who fit the profile (.e. are in their target market), but who have not yet made a purchase. Generally speaking, Tuscan Lifestyles prospects are typically middle-class females, aged 30-45, in suburban neighborhoods, with above-average education and a 'cosmopolitan outlook. To identify prospects, Tuscan Lifestyles purchases lists from various list brokers. List brokers sell or, more commonly, rent lists containing names, addresses and, often, additional information about consumers or households. Two types of lists are response lists and compiled lists. A response list is made up of people who've responded to direct mail from catalogs, card decks, internet sites, magazines, trade shows and professional journals. For example, it is possible to buy lists of people who have previously purchased CD's and DVD's through the mail or of people who have entered sweepstakes. A compiled list is a list of people who share a particular attribute. Compiled mailing and telemarketing lists are made up of names and addresses derived from telephone books, directories, public records, etc. They have not necessarily responded to any offers and are often used to reach an entire market (for example, all the architects in a specific county). For example, it is possible to buy lists of people who are female, of people who are dentists, or of people who live in Wyoming. Response lists tend to be more expensive and are thought to be more valuable by many direct marketers. Catalog companies often acquire prospect names from lists of other mail order businesses since these people are known to have made mail order purchases. Lists are usually rented on a one-time basis. Tuscan Lifestyles regularly rent lists of consumers who have traveled to Italy, who subscribe to certain home decorating, travel, and cooking magazines, or who have made catalog purchases in similar categories. The cost (per name) for a prospect mailing varies depending on the nature of the list and the number of names in total. For Tuscan Lifestyles the average cost per prospect name is $0.10. These prospects are sent a catalog. The cost of sending a typical catalog is about $0.75 including printing and postage. Adding in the 10 cents per prospect name brings the cost to send a catalog to a prospect to $0.85. Page 3 The industry average for response rates from prospect lists ranges from less than 1.0% to approximately 2.0% depending on the source of the list. Tuscan Lifestyles has realized an above-average response rate averaging 2.3% meaning that, on average, every 1000 catalogs sent to prospects will yield 23 new customers who place an order: Valuing Customers It is well known that some customers are more valuable than others. Over time, some customers purchase more often and make larger purchases than others. Other customers may purchase once- and never again, despite repeated catalog mailings. The difficult part is determining how to distinguish the more profitable customers from the less profitable customers - as early as possible in the customer's lifecycle. Unfortunately, when a customer walks into a store or places an order, there is no easy way to know just how profitable (or unprofitable) that customer may ultimately turn out to be. While businesses have long considered customers to be assets, the advent of detailed databases with individual customer level data makes it possible to value customers in much the same way that other assets have been valued. Like assets such as machines, bonds, or stocks, customers are acquired at some cost. Over time, customers generate both revenues as well as the costs to retain them and to develop them into better customers. The lifetime value of a new customer is the discounted) stream of net cash flows - including revenues from purchases less the cost of goods sold as well as the costs to acquire, develop and retain the customer The difficult part is being able to predict the future revenue and cost streams for any given customer or group of customers. Businesses often study the past purchase behavior of different customer groups and then use the findings to predict how a new customer is likely to behave. For example, a bank may sort through their customer database to identify customers whose first contact with the bank was to open a student checking account. Then, using historical data from these customers, the bank can compute various statistics such as the average account balance over time, the average number of checks written, ATM transactions and teller transactions, the average duration of the relationship with the bank, and the likelihood that other services such as a car loan or credit card are acquired from the bank. Combined with knowledge of the costs of providing these services, the bank can assess the average profitability or value per customer for this group. The same analysis can be repeated for other customer groups. In addition, as the bank accumulates information on specific customers, it is possible to refine customer value calculations using individual-level data. These customer value findings can be used tailor marketing plans for different groups, as input for resource allocation decisions, and as a metric to assess the performance of different marketing plans. What's a New Tuscan Lifestyles Customer Worth? Although a widely held maxim in direct marketing is that past behavior is a good predictor of future behavior - for a brand new customer there is little past behavior on which to build a forecast. However, Joan wonders whether a new Tuscan Lifestyles customer's early behavior might be indicative of their future behavior. Specifically, she wonders whether the dollar value of a customer's very first order is predictive of their future orders and their ultimate value as a customer The DMA 2001 State of the Catalog Stady Page 4 To assess whether the long-term value of customers making small initial purchases differs from the long-term value of customers making relatively large initial purchases, Joan had an analyst in the IT department extract some key information from the customer database. As a starting point, Joan thought that 5 years might be a reasonable time horizon for lifetime value calculations for the Tuscan Lifestyles business. Joan asked the analyst to identify all customers who made their first purchase 6 years ago. In total there were 7953 new customers 6 years ago. Across all these new customers, the average dollar amount of the initial order was approximately $58 The next step was to extract the purchase history for these 7953 customers over the subsequent 5 years since their initial purchase. Since customers made their initial purchases at different times in the calendar year, 'Year 1' for one customer may span March to March whereas "Year 1' for another customer may span September to September. The important thing is that Year 1 for any given customer begins immediately following their initial purchase. Years 2 through 5 reflect customers' purchases in their second year as a customer, their third year as a customer, and so on. So for each of these 7953 customers, the analyst tracked their initial purchase plus purchases in the 5 years following the initial purchase. Once a prospect places an order, they are entered into Tuscan Lifestyles customer database. Tuscan Lifestyles mails 8 catalogs annually to all customers on its list. The merchandise featured in the catalogs changes and includes a mix of popular 'staple items along with seasonal and holiday items. The cost of a mailing a catalog to a customer averages $0.75 (printing and postage included). Since it is hard to know when or if a customer will place another order, Tuscan Lifestyles has continued to mail catalogs to all its customers. That is, Tuscan Lifestyles has yet to drop any names from the customer list. Since the average initial purchase was $58, Joan decided that $50 was a reasonable cut point to divide customers into two groups: those who placed relatively small initial orders and those who placed larger initial orders. Of the total, there were 4657 customers that made an initial purchase less than $50 and 3296 customers with an initial purchase of at least $50. Next, for each of the two groups the analyst created a report summarizing the number of repeat purchases in each of their first 5 years as customers of Tuscan Lifestyles. In any given year, there were some who did not make a repeat purchase, some who made one additional purchase, and some who made two, three or even more repeat purchases. Exhibits 1 and 2 summarize these results. In interpreting these exhibits, note that the numbers for Year 1" reflects orders placed during customers' first year as a customer, that "Year 2' results reflect orders placed during customers' second year as a customer, and so on through Year 5. Finally, for each of the two groups the analyst computed the average initial order size (in dollars) and the average repeat order size for years 1 through 5. This information is summarized in Exhibit 3. Joan believes that this information, in conjunction with some basic cost figures, will allow her to compute the average customer lifetime value for these two groups. Gross margins are 42 percent of sales and include all costs (e.g. cost of goods sold plus the cost to take and ship the order) aside from the cost of sending the catalogs. For discounting cash flows, Tuscan Lifestyles corporate financial policy dictates a cost of capital of 10%. Armed with the information Joan is eager to see whether her hunch that a customer's initial purchase amount might be predictive of their overall customer lifetime value is correct. If Page 6 Exhibit 1 Number of orders per year (not including initial purchase) for customers who first bought 6 years ago and whose initial order was less than $50 Year 1 Number of orders 0 1 2 3 4 5 Total Frequency 611 3508 416 94 21 7 4657 Percent 13.1 75.3 8.9 2.0 Cumulative Percent 13.1 88.4 97.4 99.4 99.8 100.0 2 100.0 Year 2 Number of orders 1 2 Frequency 2739 1441 332 100 30 9 3 1 4 5 6 7 Percent 58.8 30.9 7.1 2.1 .6 2 .1 .0 .0 .0 100.0 Cumulative Percent 58.8 89.8 96.9 99.0 99.7 99.9 99.9 100.0 100.0 100.0 9 Total 4657 Year 3 Cumulative Percent 79.2 Number of orders 0 1 2 3 4 5 6 7 10 Total Frequency 3687 671 207 68 19 1 2 Percent 792 14.4 4.4 1.5 4 0 .0 0 .0 100.0 93.6 98.0 99.5 99.9 99.9 100.0 100.0 100.0 1 1 4657 Page 7 Exhibit 1 (continued) Year 4 Number of orders 2 3 4 5 6 Total Frequency 3730 661 185 56 14 9 2 4657 Percent 80.1 14.2 4.0 1.2 13 2 .0 100.0 Cumulative Percent 80.1 94.3 983 99.5 99.8 100.0 100.0 Year 5 Number of orders 2 3 4 5 8 Total Frequency 3837 626 141 38 10 3 2 4657 Percent 824 13.4 3.0 8 2 1 0 100.0 Cumulative Percent 824 958 98.9 99.7 99.9 100.0 100.0 Page 8 Exhibit 2 Number of orders per year (not including initial purchase) for customers who first bought 6 years ago and whose initial order was $50 or more Year 1 Number of orders Frequency Percent 128 714 120 28 0 1 2 3 4 5 6 7 8 Total 421 2354 397 91 20 6 5 1 1 3296 NN DONNO 60 Cumulative Percent 128 842 96.2 99.0 99.6 99.8 99.9 100.0 100.0 1000 Year 2 Number of orders Cumulative Percent 83.8 94.6 982 Frequency 1643 1120 354 121 37 12 5 3 1 3296 Percent 49.8 34.0 10.7 3.7 1.1 4 1 2 3 4 5 6 7 13 Total 99.4 NO 99.7 99.9 1000 100.0 100.0 9 of 10 Exhibit continued CA . 1 993 . 00 3 20 . Page 1 Exhibit Inital and Repeat Order Dollar Ameurts by Year and by Group S SS SS more LORE AT 16 1841 BE Devi 8 RE IN IN . al 4 A 8 c D E F G Calculations Lifetime Value Tuscan Lifestyles: Initial order $50 1 2 3 4 5 6 7 Timeo Year 1 Year 2 Year 3 Year 4 Year 5 2.30% Prospects Acquired Customers Ordering Customers Response Rale % Retention Rate % Avg # Orders (FREQUENCY) Total Number of Orders Order Size S (ON AVERAGE) Revenues 5 Cost of Good Sold (THESE ARE THE VARIABLE COSTS) Total Contribution Catalog-related (Marketing Costs (for Prospecting in Time 0 and Retention in Years 1-5}$ Net Marketing Contributions Discount rate NPV Net Marketing Contribution Cumulative NPV Customer I TV Industomer 50.00 1 $0.00 50.00 1.10 $0.00 $0.00 50.00 1.21 $0.00 50.00 50.00 1.33 $0.00 $0.00 $0.00 1.46 $0.00 50.00 $0.00 1.61 $0.00 50.00 DIVO Tuscan Lifestyles: Initial order $50 Time 0 Year 1 Year 2 Year 3 Year 4 Year 5 9 10 11 12 13 14 15 16 17 18 19 20 21 22 23 24 25 26 27 28 29 30 31 32 33 34 35 36 37 38 39 40 41 42 43 44 45 46 47 48 49 50 2.30% Prospects Acquired Customers Ordering Customers Response Rates Retention Rate % Avg# Orders (FREQUENCY) Total Number of Orders Order Size S (ON AVERAGE) Revenues 5 Cost of Good Sold (VARIABLE COSTS) Total Contribution Catalog-related (Marketing Costs (for Prospecting in Time O and Retention in Years 1-5) Net Marketing Contributions Discount rate NPV Net Marketing Contribution Cumulative NPV Customer LTV.per acquired customer $0.00 1 $0.00 $0.00 1.10 $0.00 $0.00 $0.00 121 $0.00 $0.00 $0 00 1.33 $0.00 $0.00 $0 00 1.46 $0.00 $0.00 $0.00 1.61 $0.00 $0.00 BDIV 52 53 ITALY Tuscan Lifestyles: Assessing Customer Lifetime Value Marketers ... have assembled vast databases identifying their customers and their buying habits. With such information, companies now believe it's as important to reach the right people as it is to reach lots of people. - Business Week. September 23, 1991 It was late one afternoon in February and Joan Beckman was finishing her first month as marketing director for the Tuscan Lifestyles catalog. In a market environment increasingly cluttered with catalogs, one of her top priorities is to begin to use their database of customer Information. She is certain that the accumulated purchase history of their customers can be used to increase the effectiveness and efficiency of future marketing expenditures. The Tuscan Lifestyles catalog markets cookware, tableware, linens, and decorative home accessories - all in a style reflective of the Tuscany region in Italy. The catalog has been in business for nearly nine years and has gradually increased its customer base. Tuscan Lifestyles marketing approach has been primarily product-focused with the goal of building a solid base of popular, 'staple' items which are complemented by a changing assortment of both seasonal and trendier items. Like other catalogs, and retail businesses in general, Tuscan Lifestyles seeks cost- effective ways to find and retain a loyal customer base. Many of the items in the catalog are This case was produced by Professor Charlotte Mason of the University of North Carolina at Chapel Hil. This case serves to provide material for class discussion rather than to illustrate either effective or ineffective handling of a business situation. Names and data have been disguised to assure confidentiality. The assistance of the Direct Marketing Educational Foundation in supplying the data used for this case is gratefully acknowledged. The case is distributed by the Teradata Center for Customer Relationship Management at Duke University No part of this publication may be reproduced, stored in a retrieval system. used in a spread sheet, or transmitted in any form or by any means -electronic, mechanical, photocopying, recording or otherwise-without the permission of Charlotte Mason Page 2 exclusive and the limited data that Tuscan Lifestyles has indicates high levels of customer satisfaction. Nevertheless, like many other specialty catalog or retail businesses, Tuscan Lifestyles has many customers who make just one or two purchases in their 'life as a Tuscan Lifestyles customer. Given the nature of their products and their business, it is difficult for Tuscan Lifestyles to know whether or when a customer will make additional purchases. A customer may purchase a set of hand-painted dessert plates - and make no additional purchase for several years, but then order a full set of table linens. Another customer may make an initial purchase, followed in quick succession by two additional purchases - and then never be heard from again. While Tuscan Lifestyles can track the past purchasing history of their customers, there is no way to know when a customer stops being a customer. In contrast to businesses such as banks, telephone service or insurance, customers don't notify Tuscan Lifestyles when they stop being a customer. Instead, they just silently attrite. Finding New Customers Since it is not uncommon for a catalog to lose' half or even more of its customers from one year to the next, Tuscan Lifestyles is continually prospecting for new customers. Prospects are consumers who fit the profile (.e. are in their target market), but who have not yet made a purchase. Generally speaking, Tuscan Lifestyles prospects are typically middle-class females, aged 30-45, in suburban neighborhoods, with above-average education and a 'cosmopolitan outlook. To identify prospects, Tuscan Lifestyles purchases lists from various list brokers. List brokers sell or, more commonly, rent lists containing names, addresses and, often, additional information about consumers or households. Two types of lists are response lists and compiled lists. A response list is made up of people who've responded to direct mail from catalogs, card decks, internet sites, magazines, trade shows and professional journals. For example, it is possible to buy lists of people who have previously purchased CD's and DVD's through the mail or of people who have entered sweepstakes. A compiled list is a list of people who share a particular attribute. Compiled mailing and telemarketing lists are made up of names and addresses derived from telephone books, directories, public records, etc. They have not necessarily responded to any offers and are often used to reach an entire market (for example, all the architects in a specific county). For example, it is possible to buy lists of people who are female, of people who are dentists, or of people who live in Wyoming. Response lists tend to be more expensive and are thought to be more valuable by many direct marketers. Catalog companies often acquire prospect names from lists of other mail order businesses since these people are known to have made mail order purchases. Lists are usually rented on a one-time basis. Tuscan Lifestyles regularly rent lists of consumers who have traveled to Italy, who subscribe to certain home decorating, travel, and cooking magazines, or who have made catalog purchases in similar categories. The cost (per name) for a prospect mailing varies depending on the nature of the list and the number of names in total. For Tuscan Lifestyles the average cost per prospect name is $0.10. These prospects are sent a catalog. The cost of sending a typical catalog is about $0.75 including printing and postage. Adding in the 10 cents per prospect name brings the cost to send a catalog to a prospect to $0.85. Page 3 The industry average for response rates from prospect lists ranges from less than 1.0% to approximately 2.0% depending on the source of the list. Tuscan Lifestyles has realized an above-average response rate averaging 2.3% meaning that, on average, every 1000 catalogs sent to prospects will yield 23 new customers who place an order: Valuing Customers It is well known that some customers are more valuable than others. Over time, some customers purchase more often and make larger purchases than others. Other customers may purchase once- and never again, despite repeated catalog mailings. The difficult part is determining how to distinguish the more profitable customers from the less profitable customers - as early as possible in the customer's lifecycle. Unfortunately, when a customer walks into a store or places an order, there is no easy way to know just how profitable (or unprofitable) that customer may ultimately turn out to be. While businesses have long considered customers to be assets, the advent of detailed databases with individual customer level data makes it possible to value customers in much the same way that other assets have been valued. Like assets such as machines, bonds, or stocks, customers are acquired at some cost. Over time, customers generate both revenues as well as the costs to retain them and to develop them into better customers. The lifetime value of a new customer is the discounted) stream of net cash flows - including revenues from purchases less the cost of goods sold as well as the costs to acquire, develop and retain the customer The difficult part is being able to predict the future revenue and cost streams for any given customer or group of customers. Businesses often study the past purchase behavior of different customer groups and then use the findings to predict how a new customer is likely to behave. For example, a bank may sort through their customer database to identify customers whose first contact with the bank was to open a student checking account. Then, using historical data from these customers, the bank can compute various statistics such as the average account balance over time, the average number of checks written, ATM transactions and teller transactions, the average duration of the relationship with the bank, and the likelihood that other services such as a car loan or credit card are acquired from the bank. Combined with knowledge of the costs of providing these services, the bank can assess the average profitability or value per customer for this group. The same analysis can be repeated for other customer groups. In addition, as the bank accumulates information on specific customers, it is possible to refine customer value calculations using individual-level data. These customer value findings can be used tailor marketing plans for different groups, as input for resource allocation decisions, and as a metric to assess the performance of different marketing plans. What's a New Tuscan Lifestyles Customer Worth? Although a widely held maxim in direct marketing is that past behavior is a good predictor of future behavior - for a brand new customer there is little past behavior on which to build a forecast. However, Joan wonders whether a new Tuscan Lifestyles customer's early behavior might be indicative of their future behavior. Specifically, she wonders whether the dollar value of a customer's very first order is predictive of their future orders and their ultimate value as a customer The DMA 2001 State of the Catalog Stady Page 4 To assess whether the long-term value of customers making small initial purchases differs from the long-term value of customers making relatively large initial purchases, Joan had an analyst in the IT department extract some key information from the customer database. As a starting point, Joan thought that 5 years might be a reasonable time horizon for lifetime value calculations for the Tuscan Lifestyles business. Joan asked the analyst to identify all customers who made their first purchase 6 years ago. In total there were 7953 new customers 6 years ago. Across all these new customers, the average dollar amount of the initial order was approximately $58 The next step was to extract the purchase history for these 7953 customers over the subsequent 5 years since their initial purchase. Since customers made their initial purchases at different times in the calendar year, 'Year 1' for one customer may span March to March whereas "Year 1' for another customer may span September to September. The important thing is that Year 1 for any given customer begins immediately following their initial purchase. Years 2 through 5 reflect customers' purchases in their second year as a customer, their third year as a customer, and so on. So for each of these 7953 customers, the analyst tracked their initial purchase plus purchases in the 5 years following the initial purchase. Once a prospect places an order, they are entered into Tuscan Lifestyles customer database. Tuscan Lifestyles mails 8 catalogs annually to all customers on its list. The merchandise featured in the catalogs changes and includes a mix of popular 'staple items along with seasonal and holiday items. The cost of a mailing a catalog to a customer averages $0.75 (printing and postage included). Since it is hard to know when or if a customer will place another order, Tuscan Lifestyles has continued to mail catalogs to all its customers. That is, Tuscan Lifestyles has yet to drop any names from the customer list. Since the average initial purchase was $58, Joan decided that $50 was a reasonable cut point to divide customers into two groups: those who placed relatively small initial orders and those who placed larger initial orders. Of the total, there were 4657 customers that made an initial purchase less than $50 and 3296 customers with an initial purchase of at least $50. Next, for each of the two groups the analyst created a report summarizing the number of repeat purchases in each of their first 5 years as customers of Tuscan Lifestyles. In any given year, there were some who did not make a repeat purchase, some who made one additional purchase, and some who made two, three or even more repeat purchases. Exhibits 1 and 2 summarize these results. In interpreting these exhibits, note that the numbers for Year 1" reflects orders placed during customers' first year as a customer, that "Year 2' results reflect orders placed during customers' second year as a customer, and so on through Year 5. Finally, for each of the two groups the analyst computed the average initial order size (in dollars) and the average repeat order size for years 1 through 5. This information is summarized in Exhibit 3. Joan believes that this information, in conjunction with some basic cost figures, will allow her to compute the average customer lifetime value for these two groups. Gross margins are 42 percent of sales and include all costs (e.g. cost of goods sold plus the cost to take and ship the order) aside from the cost of sending the catalogs. For discounting cash flows, Tuscan Lifestyles corporate financial policy dictates a cost of capital of 10%. Armed with the information Joan is eager to see whether her hunch that a customer's initial purchase amount might be predictive of their overall customer lifetime value is correct. If Page 6 Exhibit 1 Number of orders per year (not including initial purchase) for customers who first bought 6 years ago and whose initial order was less than $50 Year 1 Number of orders 0 1 2 3 4 5 Total Frequency 611 3508 416 94 21 7 4657 Percent 13.1 75.3 8.9 2.0 Cumulative Percent 13.1 88.4 97.4 99.4 99.8 100.0 2 100.0 Year 2 Number of orders 1 2 Frequency 2739 1441 332 100 30 9 3 1 4 5 6 7 Percent 58.8 30.9 7.1 2.1 .6 2 .1 .0 .0 .0 100.0 Cumulative Percent 58.8 89.8 96.9 99.0 99.7 99.9 99.9 100.0 100.0 100.0 9 Total 4657 Year 3 Cumulative Percent 79.2 Number of orders 0 1 2 3 4 5 6 7 10 Total Frequency 3687 671 207 68 19 1 2 Percent 792 14.4 4.4 1.5 4 0 .0 0 .0 100.0 93.6 98.0 99.5 99.9 99.9 100.0 100.0 100.0 1 1 4657 Page 7 Exhibit 1 (continued) Year 4 Number of orders 2 3 4 5 6 Total Frequency 3730 661 185 56 14 9 2 4657 Percent 80.1 14.2 4.0 1.2 13 2 .0 100.0 Cumulative Percent 80.1 94.3 983 99.5 99.8 100.0 100.0 Year 5 Number of orders 2 3 4 5 8 Total Frequency 3837 626 141 38 10 3 2 4657 Percent 824 13.4 3.0 8 2 1 0 100.0 Cumulative Percent 824 958 98.9 99.7 99.9 100.0 100.0 Page 8 Exhibit 2 Number of orders per year (not including initial purchase) for customers who first bought 6 years ago and whose initial order was $50 or more Year 1 Number of orders Frequency Percent 128 714 120 28 0 1 2 3 4 5 6 7 8 Total 421 2354 397 91 20 6 5 1 1 3296 NN DONNO 60 Cumulative Percent 128 842 96.2 99.0 99.6 99.8 99.9 100.0 100.0 1000 Year 2 Number of orders Cumulative Percent 83.8 94.6 982 Frequency 1643 1120 354 121 37 12 5 3 1 3296 Percent 49.8 34.0 10.7 3.7 1.1 4 1 2 3 4 5 6 7 13 Total 99.4 NO 99.7 99.9 1000 100.0 100.0 9 of 10 Exhibit continued CA . 1 993 . 00 3 20 . Page 1 Exhibit Inital and Repeat Order Dollar Ameurts by Year and by Group S SS SS more LORE AT 16 1841 BE Devi 8 RE IN IN . al
Step by Step Solution
There are 3 Steps involved in it

Get step-by-step solutions from verified subject matter experts