

Question: Complete Fixed Assets Cash Flows, what is the Tax Effect and Change in Fixed Assets? Complete Capital Budgeting Criteria and give a short analysis and
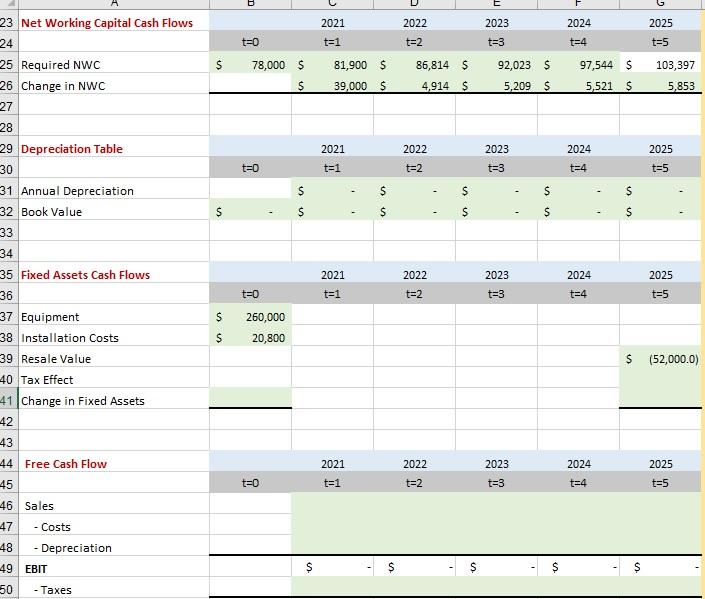
Complete Fixed Assets Cash Flows, what is the Tax Effect and Change in Fixed Assets?
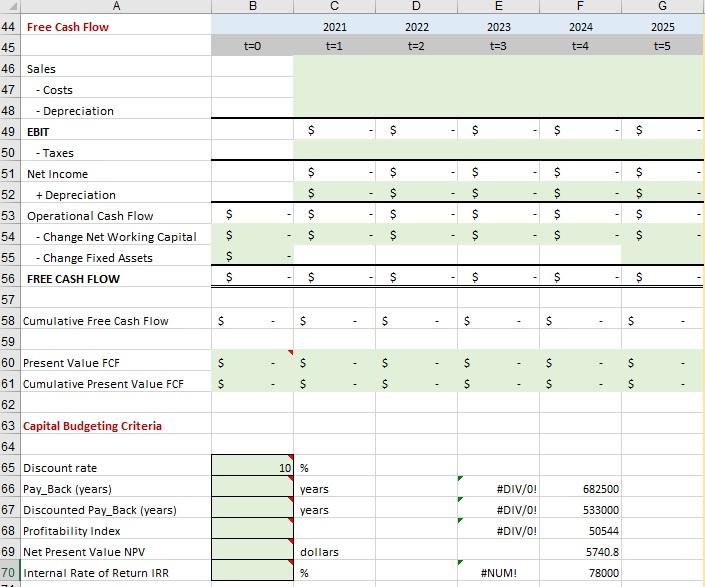
Complete Capital Budgeting Criteria and give a short analysis and decision based on the Capital Budgeting Criteria.
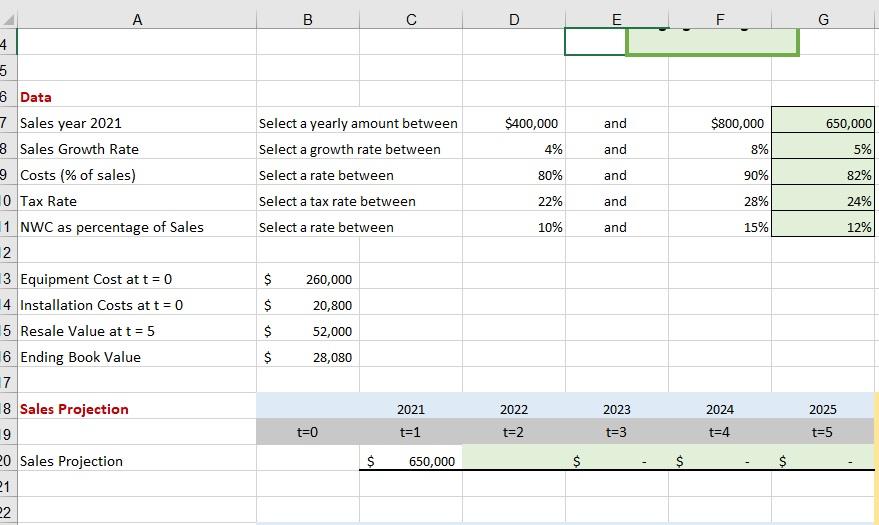
A B D E LL G $400,000 4% and and $800,000 8% 650,000 5% Select a yearly amount between Select a growth rate between Select a rate between Select a tax rate between Select a rate between 80% and 90% 82% 22% and 28% 4 5 6 Data 7 Sales year 2021 3 Sales Growth Rate 9 Costs (% of sales) 0 Tax Rate 1 NWC as percentage of Sales 2 3 Equipment Cost at t = 0 4 Installation Costs at t = 0 5 Resale Value at t = 5 6 Ending Book Value 17 8 Sales Projection 24% 10% and 15% 12% $ $ 260,000 20,800 52,000 28,080 $ $ 2024 2021 t=1 2022 t=2 2023 t=3 2025 t=5 9 t=0 t=4 $ 650,000 $ $ $ 20 Sales Projection 21 2 2 B E 2021 2022 2024 2025 2023 t=3 t=0 t=1 t=2 t=4 t=5 $ 78,000 $ 92,023 $ 81,900 $ 39,000 $ 86,814 $ 4,914 $ 97,544 $ 5,521 $ 103,397 5,853 $ 5,209 $ 2021 2022 2023 2024 2025 t=5 t=0 t=1 t=2 t=3 t=4 $ $ ! $ ! $ $ $ $ $ - $ - $ $ - 23 Net Working Capital Cash Flows 24 25 Required NWC 26 Change in NWC 27 28 29 Depreciation Table 30 31 Annual Depreciation 32 Book Value 33 34 35 Fixed Assets Cash Flows 36 37 Equipment 38 Installation Costs 39 Resale Value 40 Tax Effect 41 Change in Fixed Assets 42 2023 2021 t=1 2022 t=2 2024 t=4 2025 t=5 t=0 t=3 $ 260,000 20,800 $ $ (52,000.0) 43 44 Free Cash Flow 45 2021 t=1 2022 t=2 2023 t=3 2024 t=4 2025 t=5 t=0 46 Sales 47 - Costs 48 - Depreciation 49 EBIT 50 - Taxes $ $ $ B D E F G 2021 2025 44 Free Cash Flow 45 2022 t=2 2023 t=3 2024 t=4 t=0 t=1 t=5 46 Sales 47 - Costs 48 - Depreciation 49 EBIT 50 - Taxes $ $ $ $ $ $ 51 Net Income . $ $ S $ $ ulo $ $ - $ - . $ $ S $ $ $ ta $ $ $ $ S $ 10 $ - $ $ $ $ - $ $ $ - $ $ - $ - $ - 52 + Depreciation 53 Operational Cash Flow 54 - Change Net Working Capital 55 - Change Fixed Assets 56 FREE CASH FLOW 57 58 Cumulative Free Cash Flow 59 60 Present Value FCF 61 Cumulative Present Value FCF 62 63 Capital Budgeting Criteria 64 65 Discount rate 66 Pay_Back (years) 67 Discounted Pay_Back (years) 68 Profitability Index 69 Net Present Value NPV 70 Internal Rate of Return IRR $ $ $ $ $ $ 10 % years 682500 years #DIV/0! #DIV/0! #DIV/0! 533000 50544 dollars 5740.8 % #NUM! 78000 A B D E LL G $400,000 4% and and $800,000 8% 650,000 5% Select a yearly amount between Select a growth rate between Select a rate between Select a tax rate between Select a rate between 80% and 90% 82% 22% and 28% 4 5 6 Data 7 Sales year 2021 3 Sales Growth Rate 9 Costs (% of sales) 0 Tax Rate 1 NWC as percentage of Sales 2 3 Equipment Cost at t = 0 4 Installation Costs at t = 0 5 Resale Value at t = 5 6 Ending Book Value 17 8 Sales Projection 24% 10% and 15% 12% $ $ 260,000 20,800 52,000 28,080 $ $ 2024 2021 t=1 2022 t=2 2023 t=3 2025 t=5 9 t=0 t=4 $ 650,000 $ $ $ 20 Sales Projection 21 2 2 B E 2021 2022 2024 2025 2023 t=3 t=0 t=1 t=2 t=4 t=5 $ 78,000 $ 92,023 $ 81,900 $ 39,000 $ 86,814 $ 4,914 $ 97,544 $ 5,521 $ 103,397 5,853 $ 5,209 $ 2021 2022 2023 2024 2025 t=5 t=0 t=1 t=2 t=3 t=4 $ $ ! $ ! $ $ $ $ $ - $ - $ $ - 23 Net Working Capital Cash Flows 24 25 Required NWC 26 Change in NWC 27 28 29 Depreciation Table 30 31 Annual Depreciation 32 Book Value 33 34 35 Fixed Assets Cash Flows 36 37 Equipment 38 Installation Costs 39 Resale Value 40 Tax Effect 41 Change in Fixed Assets 42 2023 2021 t=1 2022 t=2 2024 t=4 2025 t=5 t=0 t=3 $ 260,000 20,800 $ $ (52,000.0) 43 44 Free Cash Flow 45 2021 t=1 2022 t=2 2023 t=3 2024 t=4 2025 t=5 t=0 46 Sales 47 - Costs 48 - Depreciation 49 EBIT 50 - Taxes $ $ $ B D E F G 2021 2025 44 Free Cash Flow 45 2022 t=2 2023 t=3 2024 t=4 t=0 t=1 t=5 46 Sales 47 - Costs 48 - Depreciation 49 EBIT 50 - Taxes $ $ $ $ $ $ 51 Net Income . $ $ S $ $ ulo $ $ - $ - . $ $ S $ $ $ ta $ $ $ $ S $ 10 $ - $ $ $ $ - $ $ $ - $ $ - $ - $ - 52 + Depreciation 53 Operational Cash Flow 54 - Change Net Working Capital 55 - Change Fixed Assets 56 FREE CASH FLOW 57 58 Cumulative Free Cash Flow 59 60 Present Value FCF 61 Cumulative Present Value FCF 62 63 Capital Budgeting Criteria 64 65 Discount rate 66 Pay_Back (years) 67 Discounted Pay_Back (years) 68 Profitability Index 69 Net Present Value NPV 70 Internal Rate of Return IRR $ $ $ $ $ $ 10 % years 682500 years #DIV/0! #DIV/0! #DIV/0! 533000 50544 dollars 5740.8 % #NUM! 78000
Step by Step Solution
There are 3 Steps involved in it

Get step-by-step solutions from verified subject matter experts