

Question: COMPLETE INCOME STATEMENT AND BALANCE SHEET . PLEASE SHOW WORK Exhibit 5 Star River Electronics Ltd Data on Comparable Companies Number of Shares Percent Sales
 COMPLETE INCOME STATEMENT AND BALANCE SHEET . PLEASE SHOW WORK
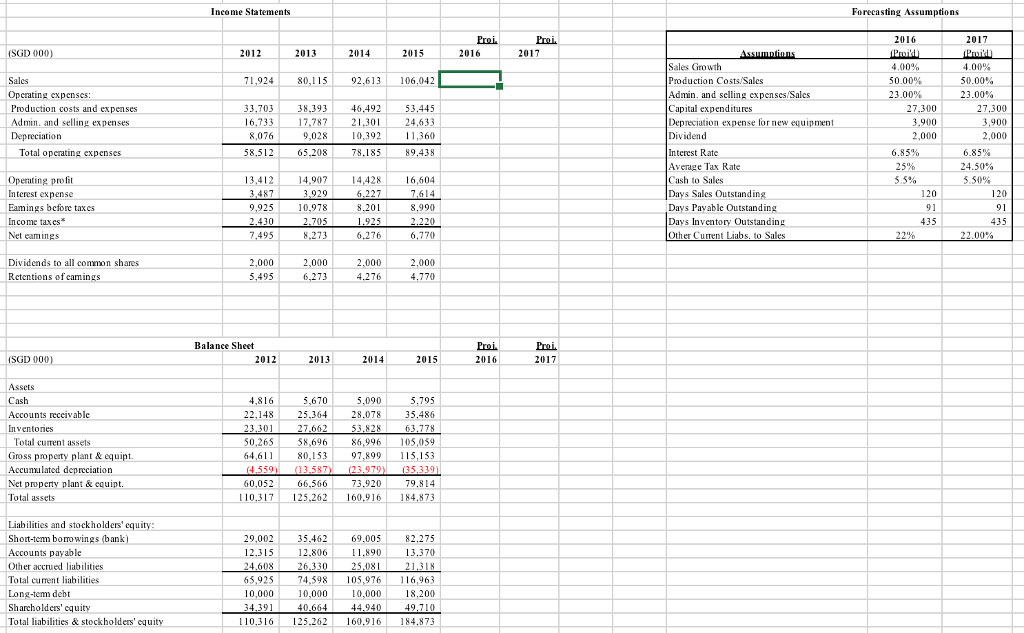
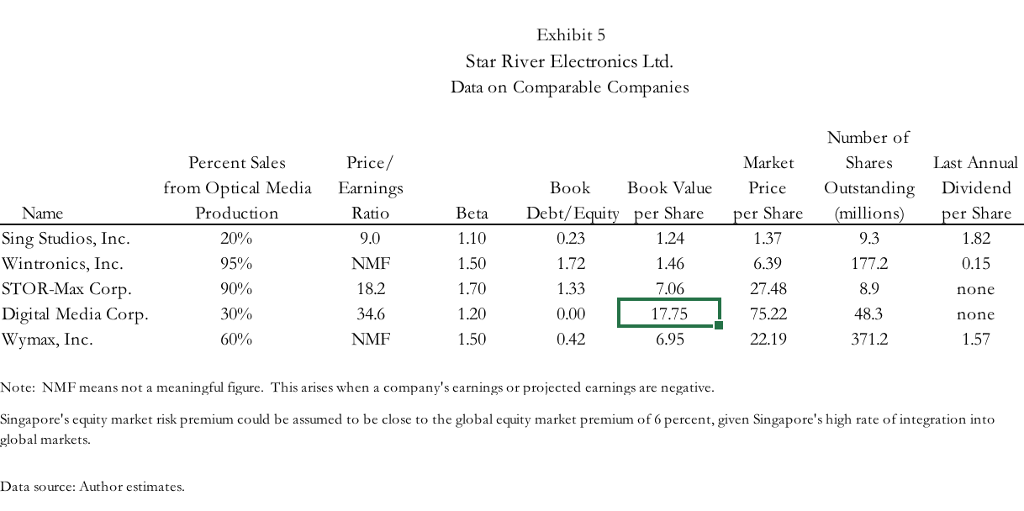
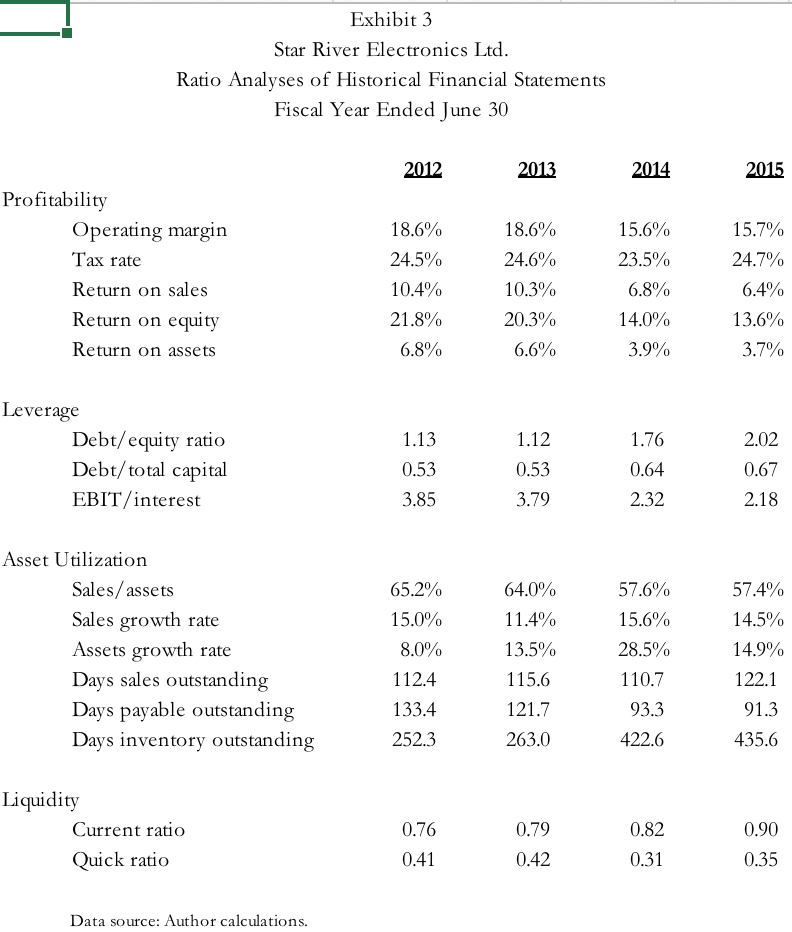
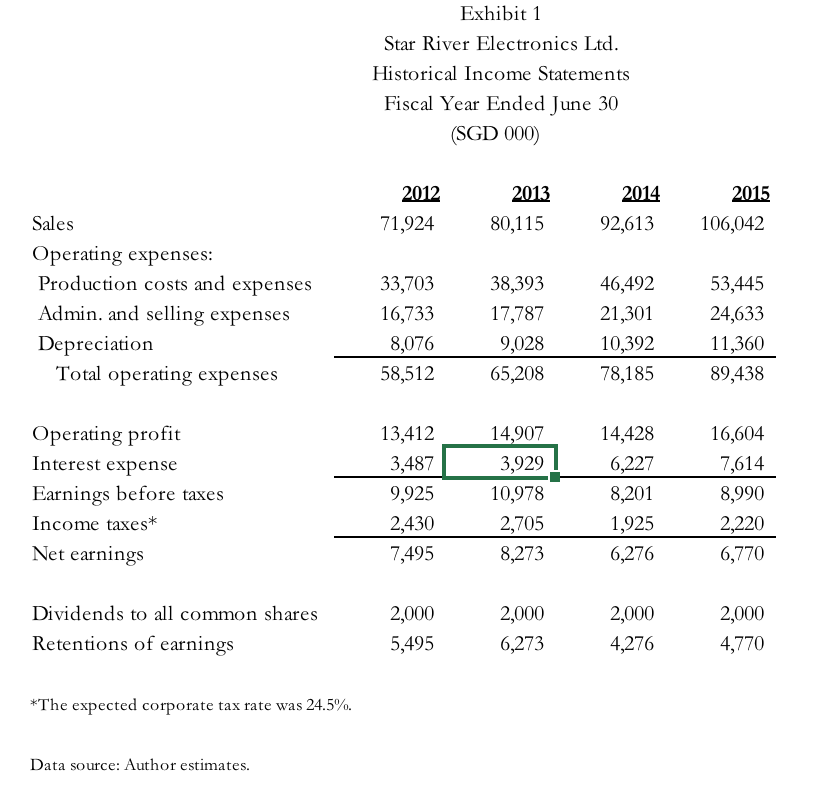
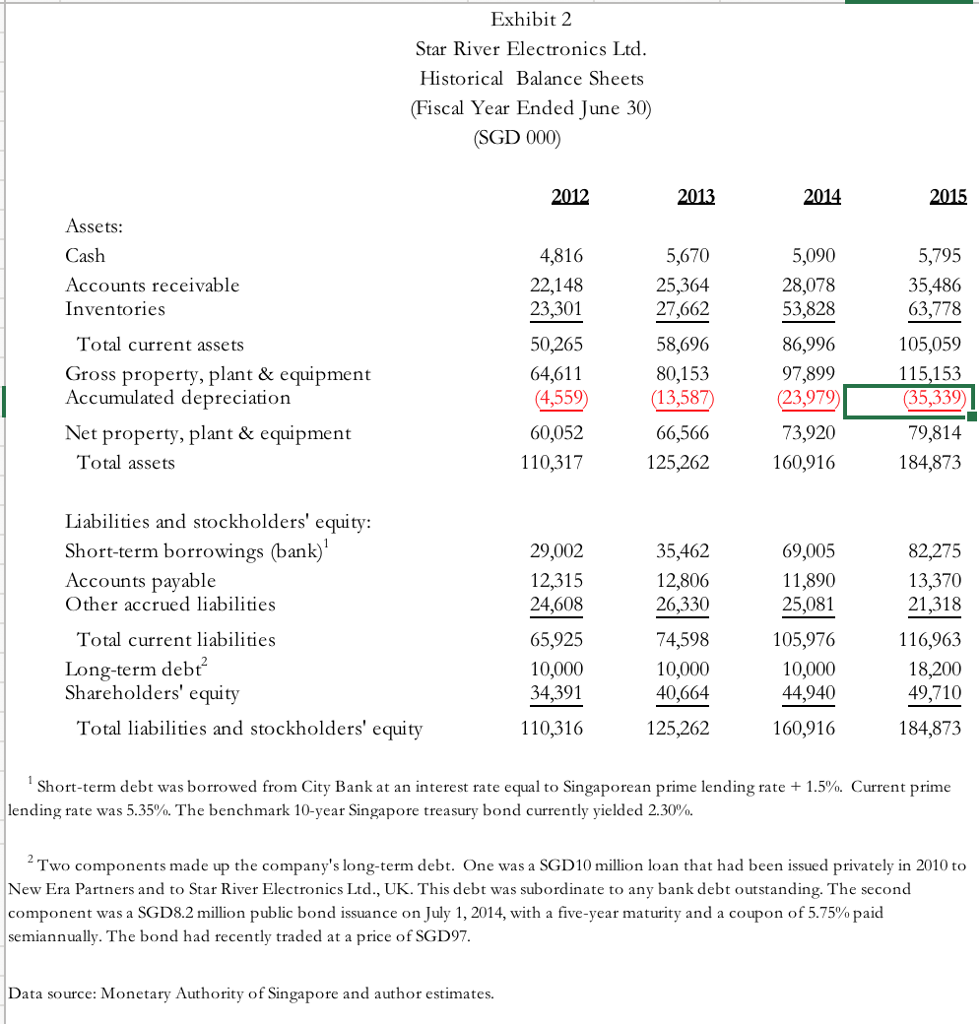
Exhibit 5 Star River Electronics Ltd Data on Comparable Companies Number of Shares Percent Sales from Optical Media Production 20% 95% 9090 30% 60% Price Earnings Ratio 9.0 NMF 18.2 34.6 NMF Market Last Annual Book Book Value Price Outstanding Dividend Name Sing Studios, Inc Wintronics, Inc STOR-Max Corp Digital Media Corp Wymax, Inc Beta Debt/Equity per Shareper Share millions 1.10 1.50 1.70 1.20 1.50 0.23 1.72 1.33 0.00 0.42 1.24 1.46 7.06 17.75 6.95 1.37 6.39 27.48 75.22 22.19 er Share 1.82 0.15 one none 1.57 9.3 8.9 48.3 371.2 Note: NMF means not a meaningful figure. This arises when a company's carnings or projected carnings are negative Singapore's equity market risk premium could be assumed to be close to the global equity market premium of 6 percent, given Singapore's high rate of integration into global markets. Data source: Author estimates Exhibit 3 Star River Electronics Ltd Ratio Analyses of Historical Financial Statements Fiscal Year Ended June 30 2012 2013 2014 2015 Profitability Operating margin Tax rate Return on sales Return on equity Return on assets 18.6% 24.5% 10.4% 21 .8% 68% 18.6% 24.6% 10.3% 20.3% 6.6% 15.6% 23.5% 68% 14.0% 3.9% 15.7% 24.7% 6.4% 13.6% 37% Leverage Debt/equity ratio Debt/total capital EBIT/interest 1.13 0.53 3.85 1.12 0.53 3.79 1.76 0.64 2.32 2.02 0.67 2.18 Asset Utilization Sales/assets Sales growth rate Assets growth rate Days sales outstanding Days payable outstanding Days inventory outstanding 65.2% 15.0% 80% 112.4 133.4 252.3 64.0% 11.4% 13.5% 115.6 121.7 263.0 575% 15.6% 28.5% 110.7 93.3 422.6 57.4% 14.5% 14.9% 122.1 91.3 435.6 Liquidity Current ratio ick ratio 0.76 0.41 0.79 0.42 0.82 0.31 0.90 0.35 Data source: Author calculations. Exhibit 1 Star River Electronics Ltd Historical Income Statements Fiscal Year Ended Tune 30 (SGD 000) 2012 71,924 2013 80,115 2015 92,613 106,042 2014 Sales Operating expenses Production costs and expenses Admin. and selling expenses Depreciation 33,703 16,733 8076 58,512 38,393 17,787 9,028 65,208 46,492 21,301 10,392 78,185 53,445 24,633 11,360 89,438 Total operating expenses Operating profit Interest expense Earnings before taxes Income taxes* Net earnings 13,412 3,487 9,925 2,430 7,495 14,907 3,929 10,978 2,705 8,273 14,428 6,227 8,201 1,925 6,276 16,604 7,614 8,990 2,220 6,770 2,000 5,495 2,000 6,273 2,000 4,276 2,000 4,770 Dividends to all common shares Retentions of earnings *The expected corporate tax rate was 24.5%. Data source: Author estimates. Exhibit 2 Star River Electronics Ltd Historical Balance Sheets (Fiscal Year Ended June 30) (SGD 000) 2012 2013 2014 2015 Assets: Cash Accounts receivable Inventories 4,816 22,148 23,301 50,265 64,611 (4,559) 60,052 110,317 5,670 25,364 27,662 58,696 80,153 (13,587 66,566 125,262 5,090 28,078 53,828 86,996 97,899 3,979 73,920 160,916 5,795 35,486 63,778 105,059 115,153 Total current assets Gross property, plant & equipment Accumulated depreciation Net property, plant &equipment 79,814 184,873 Total assets Liabilities and stockholders' equity: Short-term borrowings (bank) Accounts payable 29,002 12,315 24,608 65,925 10,000 34,391 110,316 35,462 12,806 26,330 74,598 10,000 40,664 125,262 69,005 11,890 25,081 105,976 10,000 44,940 160,916 82,275 13,370 21,318 116,963 18,200 49,710 184,873 Other accrued liabilities Total current liabilities Long-term debt' Shareholders' equity 'otal liabilities and stockholders' equity Short-term debt was borrowed from City Bank at an interest rate equal to Singaporean prime lending rate + 1.5%. Current prime lending rate was 5.35%. The benchmark 10-year Singapore treasury bond currently yielded 2.30%. 2Two components made up the company's long-term debt. One was a SGD10 million loan that had been issued privately in 2010 to New Era Partners and to Star River Electronics Ltd., UK. This debt was subordinate to any bank debt outstanding. The second component was a SGD82 million public bond issuance on July 1, 2014, with a five-year maturity and a coupon of 5.75% paid semiannually. The bond had recently traded at a price of SGD97 Data source: Monetary Authority of Singapore and author estimates. Income Statements Forecasting Assumptions Proi. 'roi, 2016 2017 GD 000) 2013 2014 2015 2016 Sales Growth Production Costs Sales Admin. and selling expenses Sales Capital expenditures Depreciation expense for new equipment Dividend Interest Rate Average Tax Rate Cash to Sales Days Sales Outstandin Days Payable Outstanding Days Inventory Outstanding Other Current Liabs. to Sales 4 00% 50.00% 50.00% Sales Operating expenses Production costs and expenses Admin. and selling expenses Depreciation 924 80,115 92,613 06,042 33.703 38.393 46.492 17.787 9,028 65.208 53,445 21,3024,633 11,360 78.185 89.438 16,733 8,076 3,900 2,000 3,900 2,000 10,392 Total operating expenses 24.50%- 5 50% 14,428 Operating profit Interest expense Eamings before taxcs income taxes* Net eamings 4,907 8 6,604 9,925 7.495 2,000 8,990 91 435 435 6,770 009 Dividends to all conmon shares Retentions of camings 495 Balance Sheet Proi Proi 2017 GD 000) 2013 Assets Cash Accounts receivable nventones 5,795 5.486 22,14825,364 28.078 58,696 80,153 97,899 15,153 Total current asset:s Gross property plant & equipt. Accunulated depreciation Net property plant& equip Total assets 50,265 64,611 86,99605,059 66,566 73.92 10.317 125.262 160,916 184,873 Liabilities and stockholders' equit Short-tem bonowings bank Accounts payable Other accrued liabilities Total current liabilities Long-tem debt Sharcholders' cquity 29,002 35,462 69.005 82,275 4,598 105,976 16,963 0,000 44.940 10,000 10,000 18,200 Total liabilities & steckholders' cquity110.316 125.262 160.916 184.873 Exhibit 5 Star River Electronics Ltd Data on Comparable Companies Number of Shares Percent Sales from Optical Media Production 20% 95% 9090 30% 60% Price Earnings Ratio 9.0 NMF 18.2 34.6 NMF Market Last Annual Book Book Value Price Outstanding Dividend Name Sing Studios, Inc Wintronics, Inc STOR-Max Corp Digital Media Corp Wymax, Inc Beta Debt/Equity per Shareper Share millions 1.10 1.50 1.70 1.20 1.50 0.23 1.72 1.33 0.00 0.42 1.24 1.46 7.06 17.75 6.95 1.37 6.39 27.48 75.22 22.19 er Share 1.82 0.15 one none 1.57 9.3 8.9 48.3 371.2 Note: NMF means not a meaningful figure. This arises when a company's carnings or projected carnings are negative Singapore's equity market risk premium could be assumed to be close to the global equity market premium of 6 percent, given Singapore's high rate of integration into global markets. Data source: Author estimates Exhibit 3 Star River Electronics Ltd Ratio Analyses of Historical Financial Statements Fiscal Year Ended June 30 2012 2013 2014 2015 Profitability Operating margin Tax rate Return on sales Return on equity Return on assets 18.6% 24.5% 10.4% 21 .8% 68% 18.6% 24.6% 10.3% 20.3% 6.6% 15.6% 23.5% 68% 14.0% 3.9% 15.7% 24.7% 6.4% 13.6% 37% Leverage Debt/equity ratio Debt/total capital EBIT/interest 1.13 0.53 3.85 1.12 0.53 3.79 1.76 0.64 2.32 2.02 0.67 2.18 Asset Utilization Sales/assets Sales growth rate Assets growth rate Days sales outstanding Days payable outstanding Days inventory outstanding 65.2% 15.0% 80% 112.4 133.4 252.3 64.0% 11.4% 13.5% 115.6 121.7 263.0 575% 15.6% 28.5% 110.7 93.3 422.6 57.4% 14.5% 14.9% 122.1 91.3 435.6 Liquidity Current ratio ick ratio 0.76 0.41 0.79 0.42 0.82 0.31 0.90 0.35 Data source: Author calculations. Exhibit 1 Star River Electronics Ltd Historical Income Statements Fiscal Year Ended Tune 30 (SGD 000) 2012 71,924 2013 80,115 2015 92,613 106,042 2014 Sales Operating expenses Production costs and expenses Admin. and selling expenses Depreciation 33,703 16,733 8076 58,512 38,393 17,787 9,028 65,208 46,492 21,301 10,392 78,185 53,445 24,633 11,360 89,438 Total operating expenses Operating profit Interest expense Earnings before taxes Income taxes* Net earnings 13,412 3,487 9,925 2,430 7,495 14,907 3,929 10,978 2,705 8,273 14,428 6,227 8,201 1,925 6,276 16,604 7,614 8,990 2,220 6,770 2,000 5,495 2,000 6,273 2,000 4,276 2,000 4,770 Dividends to all common shares Retentions of earnings *The expected corporate tax rate was 24.5%. Data source: Author estimates. Exhibit 2 Star River Electronics Ltd Historical Balance Sheets (Fiscal Year Ended June 30) (SGD 000) 2012 2013 2014 2015 Assets: Cash Accounts receivable Inventories 4,816 22,148 23,301 50,265 64,611 (4,559) 60,052 110,317 5,670 25,364 27,662 58,696 80,153 (13,587 66,566 125,262 5,090 28,078 53,828 86,996 97,899 3,979 73,920 160,916 5,795 35,486 63,778 105,059 115,153 Total current assets Gross property, plant & equipment Accumulated depreciation Net property, plant &equipment 79,814 184,873 Total assets Liabilities and stockholders' equity: Short-term borrowings (bank) Accounts payable 29,002 12,315 24,608 65,925 10,000 34,391 110,316 35,462 12,806 26,330 74,598 10,000 40,664 125,262 69,005 11,890 25,081 105,976 10,000 44,940 160,916 82,275 13,370 21,318 116,963 18,200 49,710 184,873 Other accrued liabilities Total current liabilities Long-term debt' Shareholders' equity 'otal liabilities and stockholders' equity Short-term debt was borrowed from City Bank at an interest rate equal to Singaporean prime lending rate + 1.5%. Current prime lending rate was 5.35%. The benchmark 10-year Singapore treasury bond currently yielded 2.30%. 2Two components made up the company's long-term debt. One was a SGD10 million loan that had been issued privately in 2010 to New Era Partners and to Star River Electronics Ltd., UK. This debt was subordinate to any bank debt outstanding. The second component was a SGD82 million public bond issuance on July 1, 2014, with a five-year maturity and a coupon of 5.75% paid semiannually. The bond had recently traded at a price of SGD97 Data source: Monetary Authority of Singapore and author estimates. Income Statements Forecasting Assumptions Proi. 'roi, 2016 2017 GD 000) 2013 2014 2015 2016 Sales Growth Production Costs Sales Admin. and selling expenses Sales Capital expenditures Depreciation expense for new equipment Dividend Interest Rate Average Tax Rate Cash to Sales Days Sales Outstandin Days Payable Outstanding Days Inventory Outstanding Other Current Liabs. to Sales 4 00% 50.00% 50.00% Sales Operating expenses Production costs and expenses Admin. and selling expenses Depreciation 924 80,115 92,613 06,042 33.703 38.393 46.492 17.787 9,028 65.208 53,445 21,3024,633 11,360 78.185 89.438 16,733 8,076 3,900 2,000 3,900 2,000 10,392 Total operating expenses 24.50%- 5 50% 14,428 Operating profit Interest expense Eamings before taxcs income taxes* Net eamings 4,907 8 6,604 9,925 7.495 2,000 8,990 91 435 435 6,770 009 Dividends to all conmon shares Retentions of camings 495 Balance Sheet Proi Proi 2017 GD 000) 2013 Assets Cash Accounts receivable nventones 5,795 5.486 22,14825,364 28.078 58,696 80,153 97,899 15,153 Total current asset:s Gross property plant & equipt. Accunulated depreciation Net property plant& equip Total assets 50,265 64,611 86,99605,059 66,566 73.92 10.317 125.262 160,916 184,873 Liabilities and stockholders' equit Short-tem bonowings bank Accounts payable Other accrued liabilities Total current liabilities Long-tem debt Sharcholders' cquity 29,002 35,462 69.005 82,275 4,598 105,976 16,963 0,000 44.940 10,000 10,000 18,200 Total liabilities & steckholders' cquity110.316 125.262 160.916 184.873
Step by Step Solution
There are 3 Steps involved in it

Get step-by-step solutions from verified subject matter experts