

Question: Complete MANUAL calculations for all questions, showing work (a) [2] Assign the role of independent and dependent variables to these two variables and draw a
Complete MANUAL calculations for all questions, showing work
![Complete MANUAL calculations for all questions, showing work (a) [2] Assign the](https://s3.amazonaws.com/si.experts.images/answers/2024/07/668a44ac349cf_580668a44ac1f8ba.jpg)
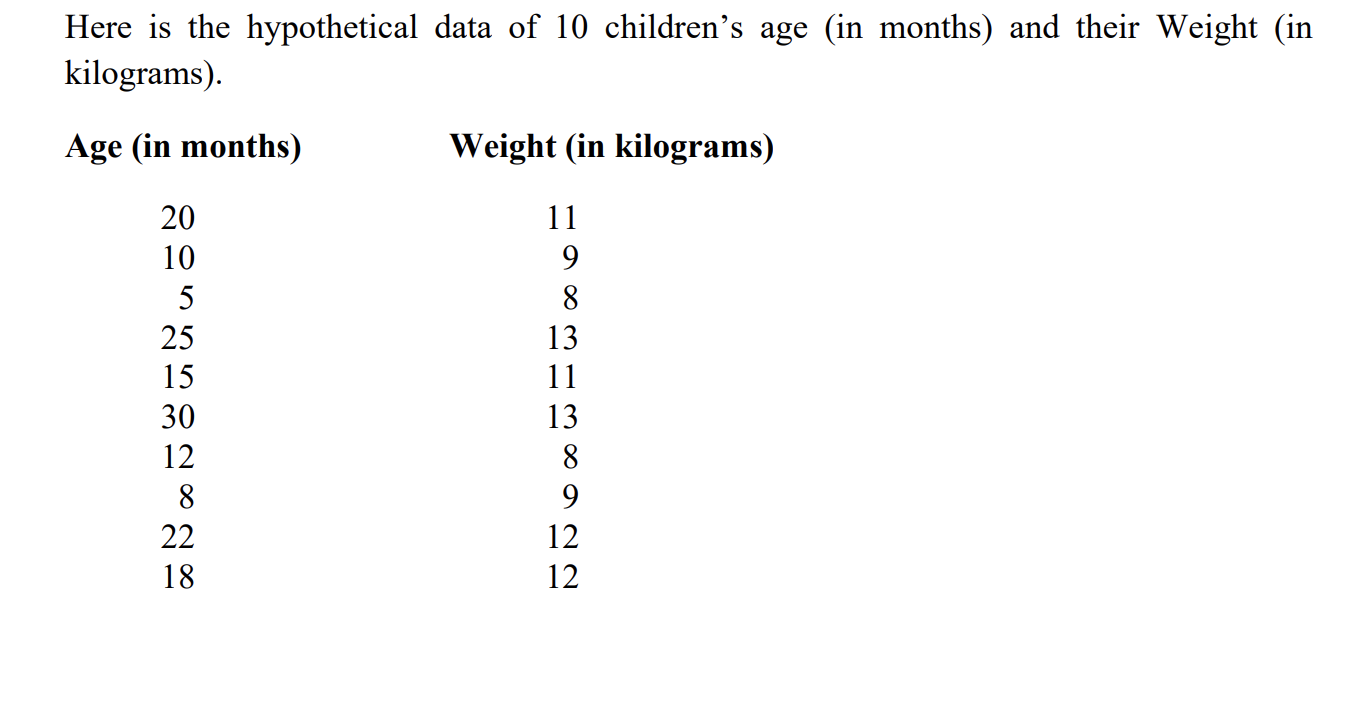
(a) [2] Assign the role of independent and dependent variables to these two variables and draw a scatter plot of age vs weight and comment on the direction of the relationship. (Using SPSS, not hand drawn) (b) [10] Calculate and interpret the Pearson Correlation Coefficient (r) to determine the linear relationship between children's age and weight. At the 0.05 level of significance, test whether children's age and weight are positively correlated. Use critical-value approach. (c) [2] Develop and write the least-squares estimated regression line to predict children's weight based age. Interpret the regression coefficient i.e., slope of the estimated regression line. (d) [6] Is the estimated regression model statistically significant? Test using 0.05 level of significance showing the detailed steps of hypothesis testing (hypotheses, test statistic, critical value, decision with justification). (Note: Use the test of slope coefficient). (e) [2] Calculate Coefficient of Determination, R2. Did the estimated regression equation provide a good fit? Explain. (f) [3] Calculate the predicted weight for the children aged 13, 19, and 26 months based on the estimated regression model developed in step (c) and find the corresponding residuals.Here is the hypothetical data of 10 children's age (in months) and their Weight (in kilograms). Age (in months) Weight (in kilograms) 20 1 1 10 9 5 8 25 1 3 15 1 1 30 1 3 12 8 8 9 22 12 18 12
Step by Step Solution
There are 3 Steps involved in it

Get step-by-step solutions from verified subject matter experts