

Question: complete part b Print Use the data points, Line A, and Line B to do the following. X 10 4 6 6 a. Graph the
complete part b
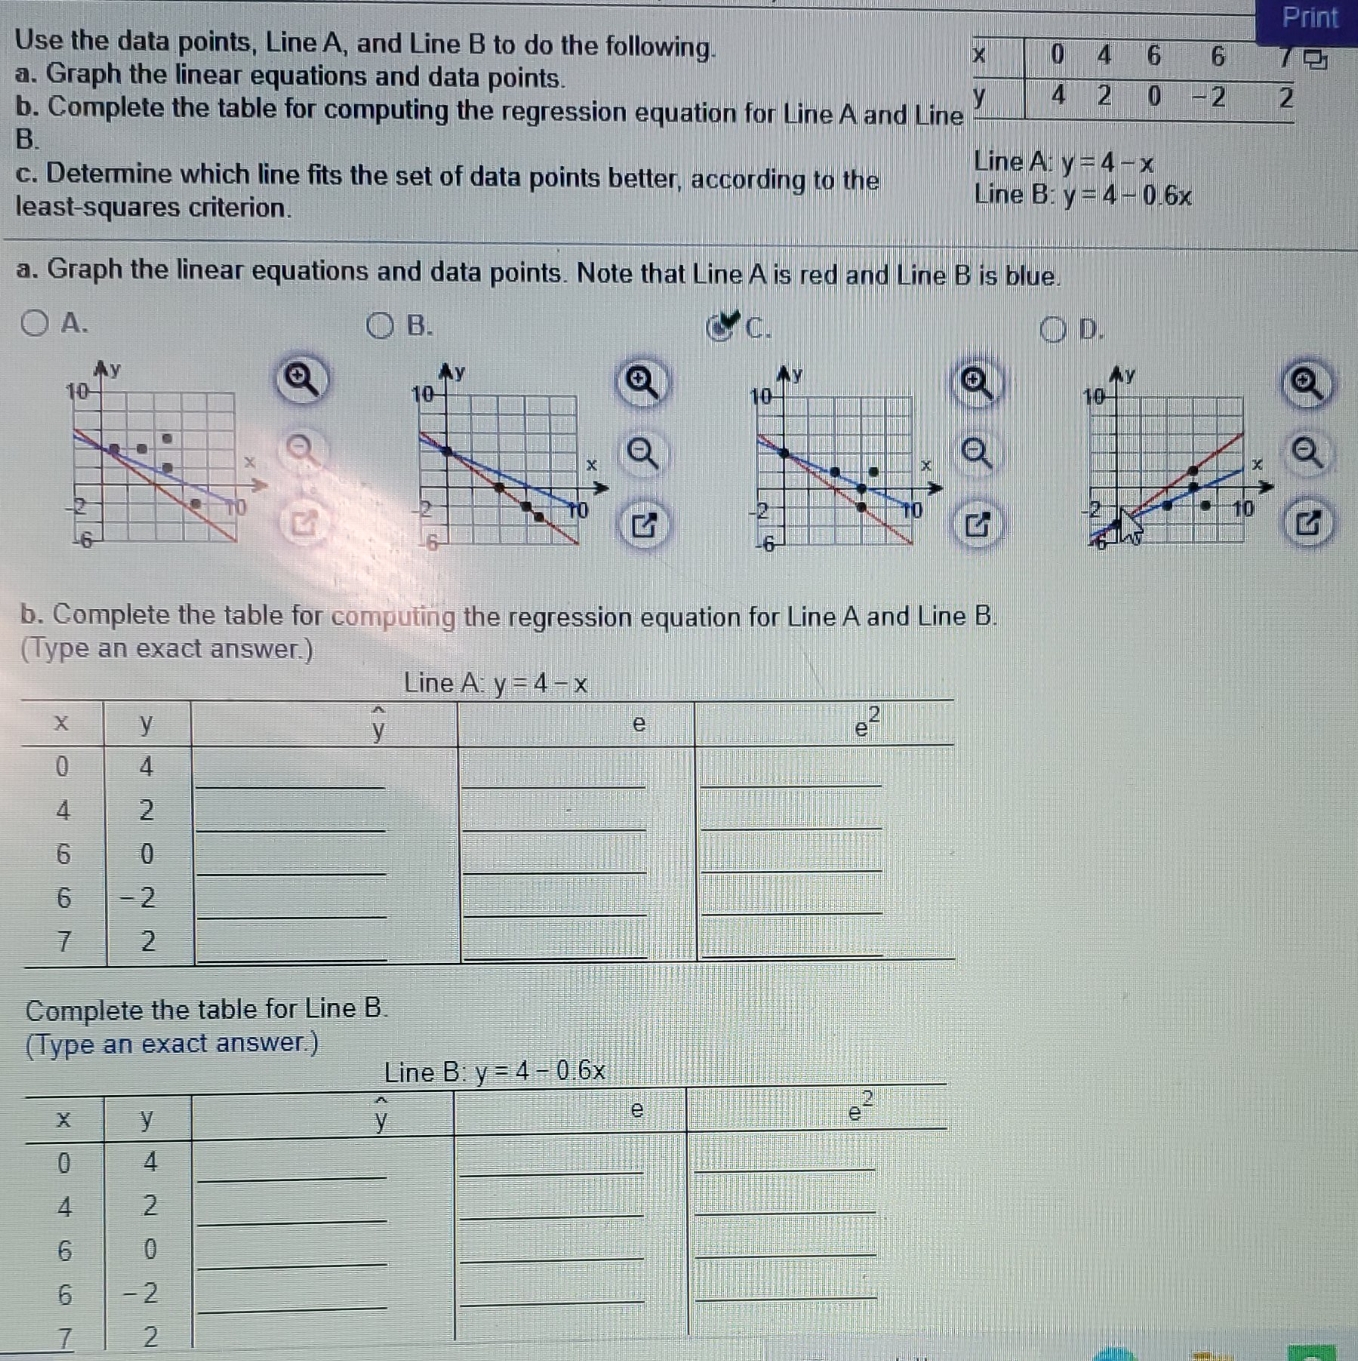
Print Use the data points, Line A, and Line B to do the following. X 10 4 6 6 a. Graph the linear equations and data points. b. Complete the table for computing the regression equation for Line A and Line y 4 2 0 -2 2 B. c. Determine which line fits the set of data points better, according to the Line A: y = 4-X Line B: y = 4- 0.6x least-squares criterion. a. Graph the linear equations and data points. Note that Line A is red and Line B is blue. OA. O B. CC. OD. 10- 10 10 b. Complete the table for computing the regression equation for Line A and Line B. (Type an exact answer.) Line A: y = 4-x X y y e NA 4 6 N Complete the table for Line B. (Type an exact answer.) Line B: y = 4 - 0.6x X y y e NA NO N
Step by Step Solution
There are 3 Steps involved in it

Get step-by-step solutions from verified subject matter experts