

Question: COMPLETE PART C & D 6. Suppose an investor allocates money across two uncorrelated (independent) investments. In particular, Investment 1 and Investment 2 have expected
COMPLETE PART C & D
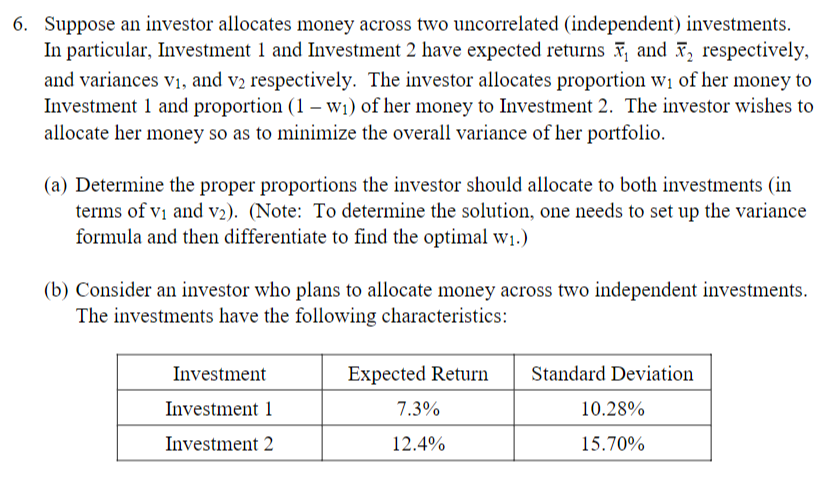
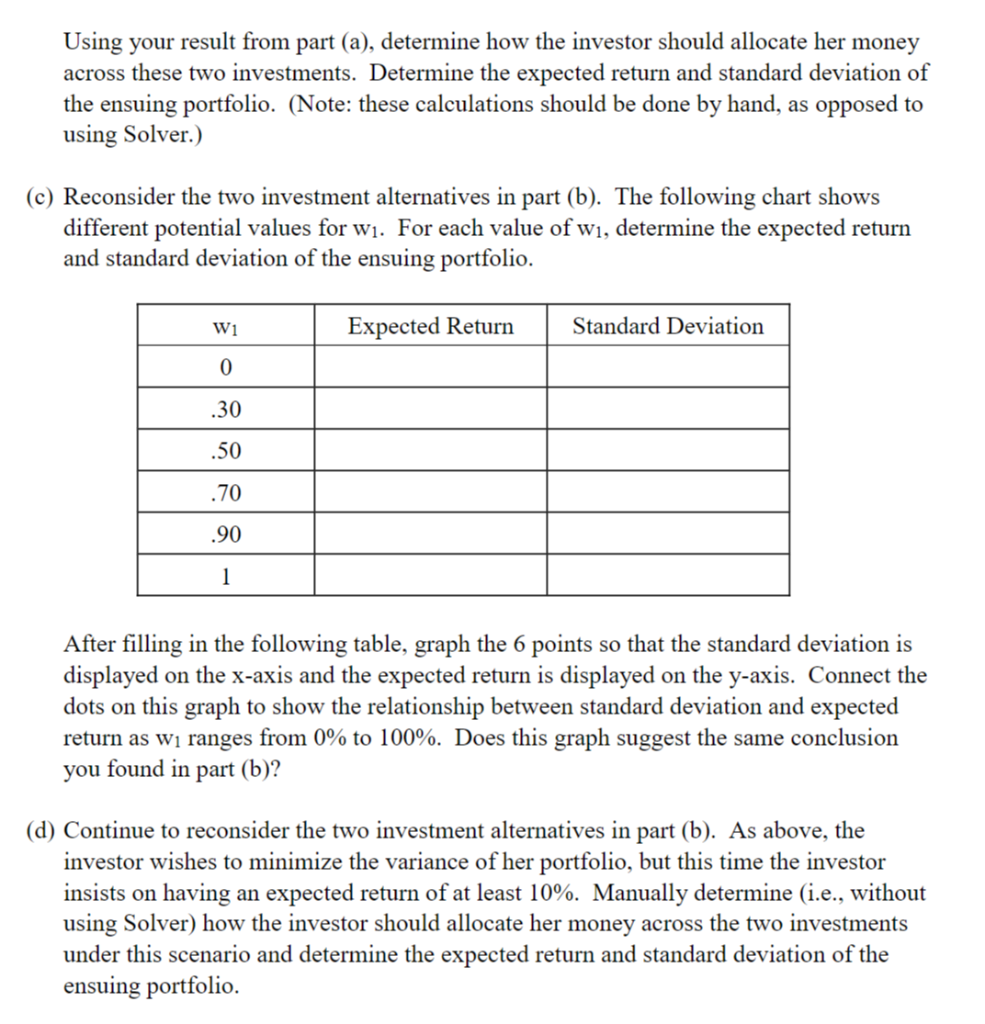
6. Suppose an investor allocates money across two uncorrelated (independent) investments. In particular, Investment 1 and Investment 2 have expected returns 7, and 7, respectively, and variances V1, and v2 respectively. The investor allocates proportion wi of her money to Investment 1 and proportion (1 W1) of her money to Investment 2. The investor wishes to allocate her money so as to minimize the overall variance of her portfolio. (a) Determine the proper proportions the investor should allocate to both investments in terms of vi and v2). (Note: To determine the solution, one needs to set up the variance formula and then differentiate to find the optimal w1.) (b) Consider an investor who plans to allocate money across two independent investments. The investments have the following characteristics: Standard Deviation Investment Investment 1 Investment 2 Expected Return 7.3% 10.28% 12.4% 15.70% Using your result from part (a), determine how the investor should allocate her money across these two investments. Determine the expected return and standard deviation of the ensuing portfolio. (Note: these calculations should be done by hand, as opposed to using Solver.) (c) Reconsider the two investment alternatives in part (b). The following chart shows different potential values for w1. For each value of w1, determine the expected return and standard deviation of the ensuing portfolio. W1 Expected Return Standard Deviation 0 .30 .50 .70 .90 1 After filling in the following table, graph the 6 points so that the standard deviation is displayed on the x-axis and the expected return is displayed on the y-axis. Connect the dots on this graph to show the relationship between standard deviation and expected return as wi ranges from 0% to 100%. Does this graph suggest the same conclusion you found in part (b)? (d) Continue to reconsider the two investment alternatives in part (b). As above, the investor wishes to minimize the variance of her portfolio, but this time the investor insists on having an expected return of at least 10%. Manually determine (i.e., without using Solver) how the investor should allocate her money across the two investments under this scenario and determine the expected return and standard deviation of the ensuing portfolio. 6. Suppose an investor allocates money across two uncorrelated (independent) investments. In particular, Investment 1 and Investment 2 have expected returns 7, and 7, respectively, and variances V1, and v2 respectively. The investor allocates proportion wi of her money to Investment 1 and proportion (1 W1) of her money to Investment 2. The investor wishes to allocate her money so as to minimize the overall variance of her portfolio. (a) Determine the proper proportions the investor should allocate to both investments in terms of vi and v2). (Note: To determine the solution, one needs to set up the variance formula and then differentiate to find the optimal w1.) (b) Consider an investor who plans to allocate money across two independent investments. The investments have the following characteristics: Standard Deviation Investment Investment 1 Investment 2 Expected Return 7.3% 10.28% 12.4% 15.70% Using your result from part (a), determine how the investor should allocate her money across these two investments. Determine the expected return and standard deviation of the ensuing portfolio. (Note: these calculations should be done by hand, as opposed to using Solver.) (c) Reconsider the two investment alternatives in part (b). The following chart shows different potential values for w1. For each value of w1, determine the expected return and standard deviation of the ensuing portfolio. W1 Expected Return Standard Deviation 0 .30 .50 .70 .90 1 After filling in the following table, graph the 6 points so that the standard deviation is displayed on the x-axis and the expected return is displayed on the y-axis. Connect the dots on this graph to show the relationship between standard deviation and expected return as wi ranges from 0% to 100%. Does this graph suggest the same conclusion you found in part (b)? (d) Continue to reconsider the two investment alternatives in part (b). As above, the investor wishes to minimize the variance of her portfolio, but this time the investor insists on having an expected return of at least 10%. Manually determine (i.e., without using Solver) how the investor should allocate her money across the two investments under this scenario and determine the expected return and standard deviation of the ensuing portfolio
Step by Step Solution
There are 3 Steps involved in it

Get step-by-step solutions from verified subject matter experts