

Question: Complete parts (a) through (c) using the following data. Row 1 2 3 4 5 5 5 6 5 8 Row 2 06 87 85
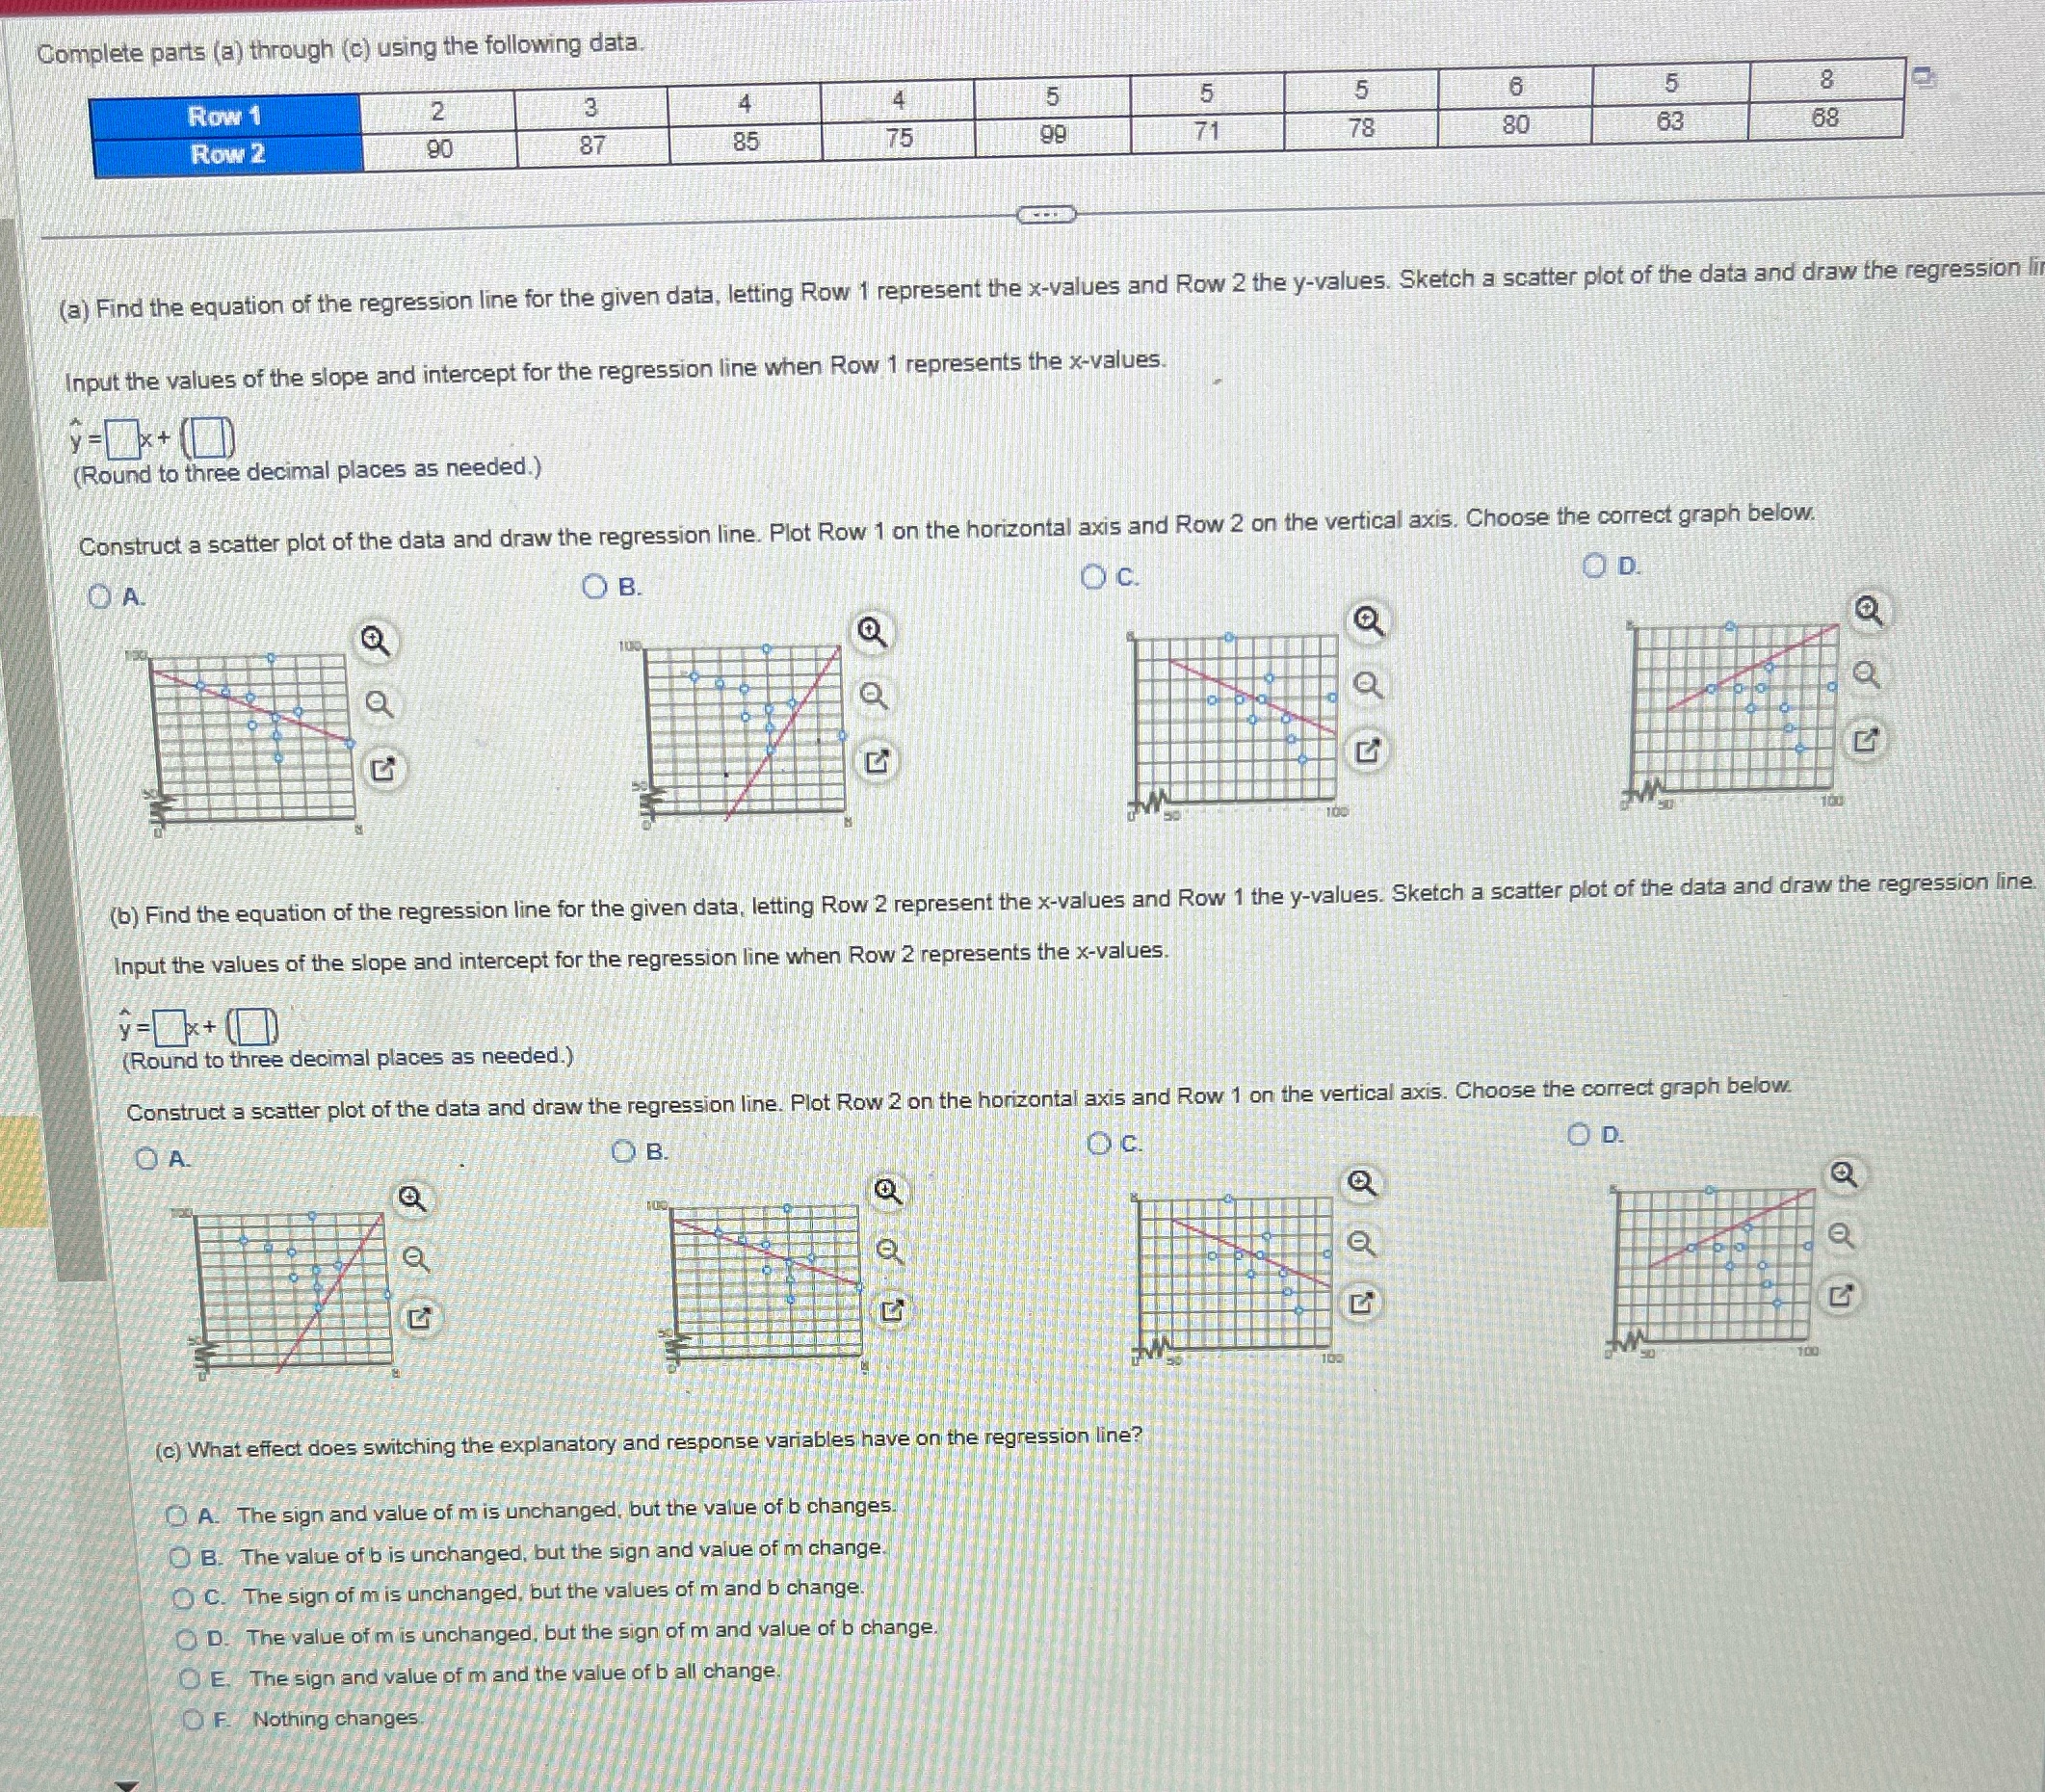
Complete parts (a) through (c) using the following data. Row 1 2 3 4 5 5 5 6 5 8 Row 2 06 87 85 75 99 71 78 80 63 68 a) Find the equation of the regression line for the given data, letting Row 1 represent the x-values and Row 2 the y-values. Sketch a scatter plot of the data and draw the regression Input the values of the slope and intercept for the regression line when Row 1 represents the x-values. (Round to three decimal places as needed.) Construct a scatter plot of the data and draw the regression line. Plot Row 1 on the horizontal axis and Row 2 on the vertical axis. Choose the correct graph below. OA. O B. OC. OD (b) Find the equation of the regression line for the given data, letting Row 2 represent the x-values and Row 1 the y-values. Sketch a scatter plot of the data and draw the regression line. Input the values of the slope and intercept for the regression line when Row 2 represents the x-values. y=\\+0) Round to three decimal places as needed.) Construct a scatter plot of the data and draw the regression line. Plot Row 2 on the horizontal axis and Row 1 on the vertical axis. Choose the correct graph below. DA. O B. DC. OD. a (c) What effect does switching the explanatory and response variables have on the regression line? Q A. The sign and value of m is unchanged, but the value of b changes B. The value of b is unchanged, but the sign and value of m change. O C. The sign of mis unchanged, but the values of m and b change O D. The value of mis unchanged, but the sign of m and value of b change O'E. The sign and value of m and the value of b all change OF. Nothing changes
Step by Step Solution
There are 3 Steps involved in it

Get step-by-step solutions from verified subject matter experts