

Question: Complete parts a through d below using the partially completed one-way ANOVA table shown. Source of Variation SS of MS F-ratio Between groups 2 Within
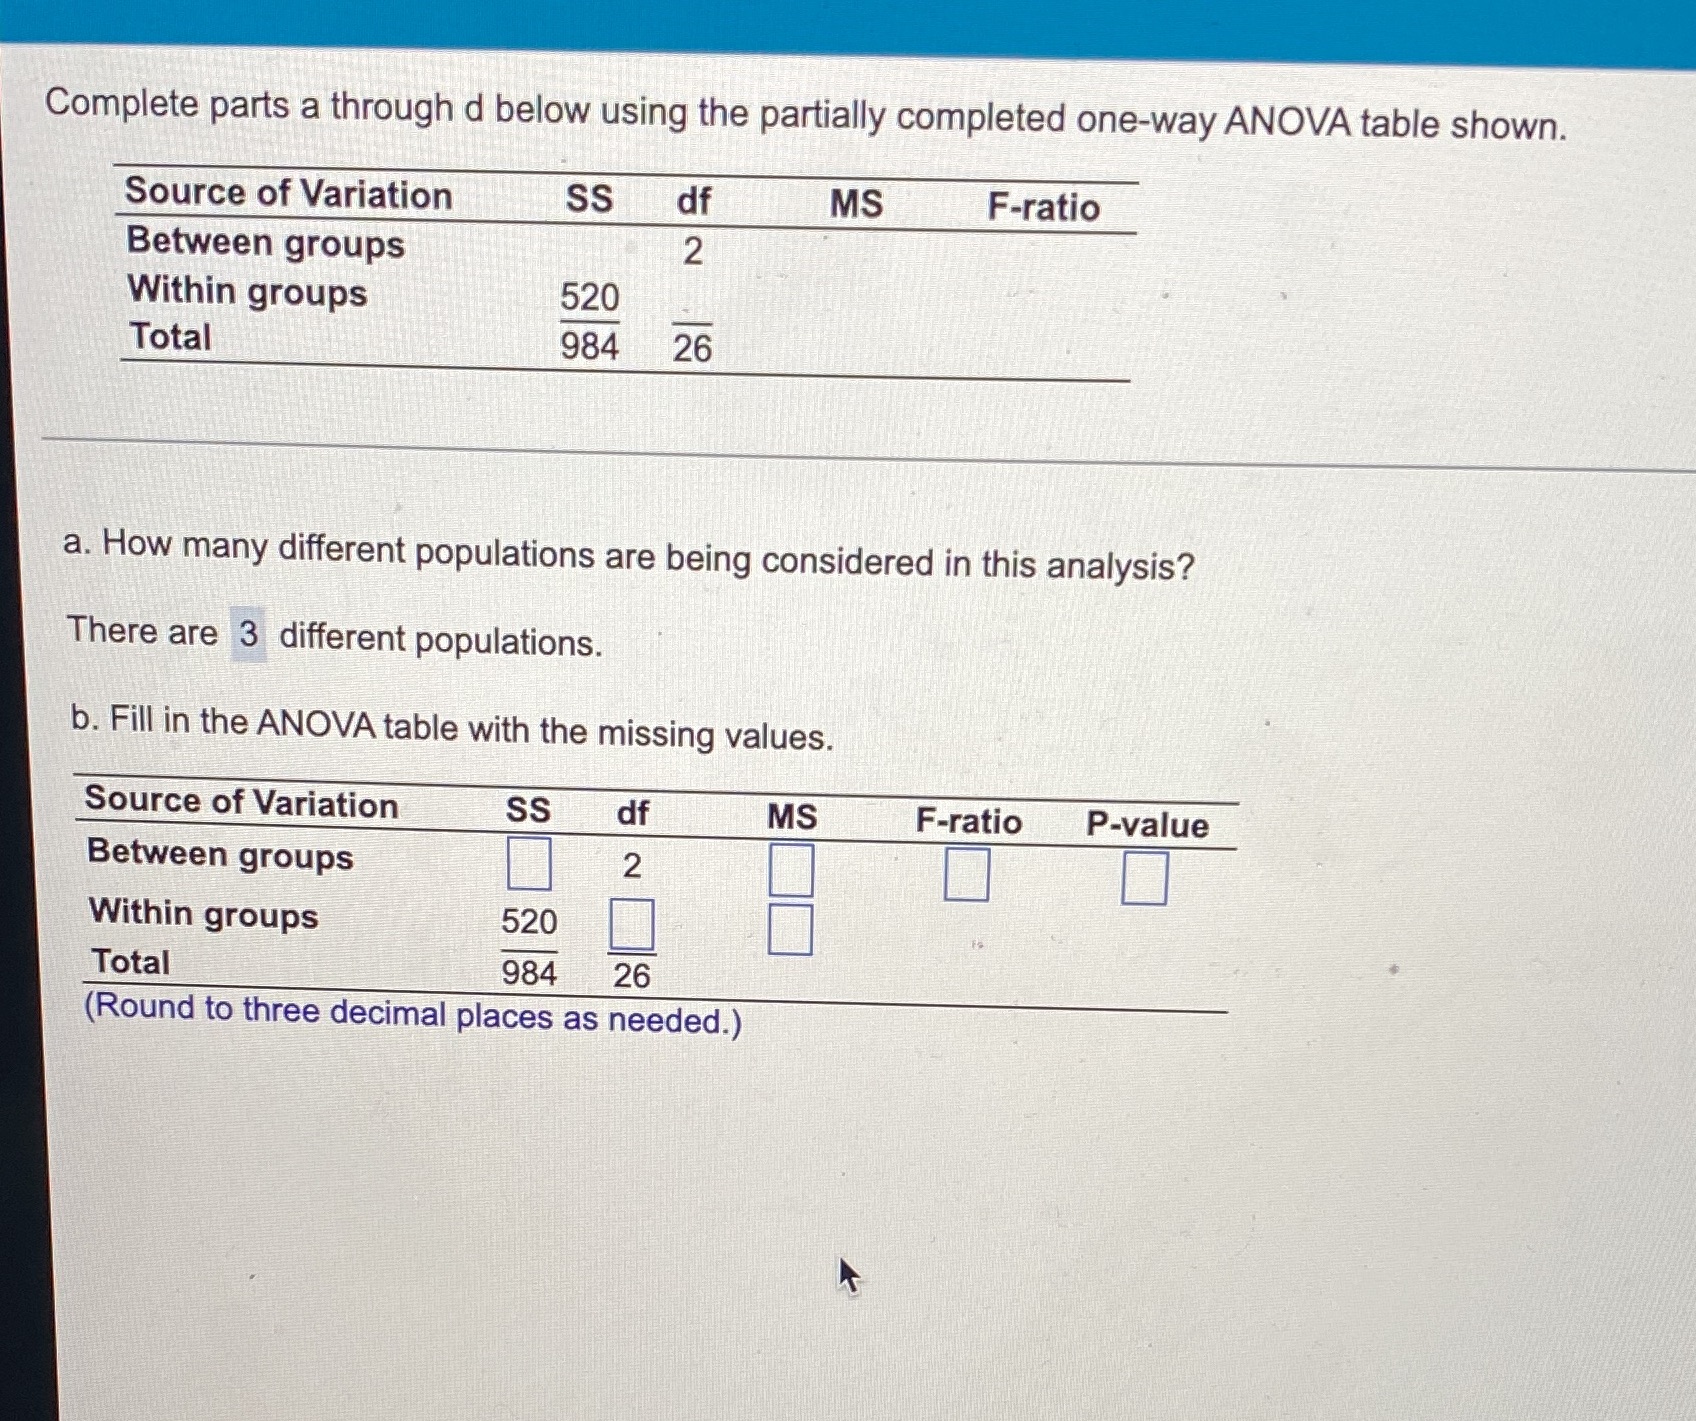
Complete parts a through d below using the partially completed one-way ANOVA table shown. Source of Variation SS of MS F-ratio Between groups 2 Within groups 520 Total 984 26 a. How many different populations are being considered in this analysis? There are 3 different populations. b. Fill in the ANOVA table with the missing values. Source of Variation SS df MS F-ratio P-value Between groups 2 Within groups 520 Total 984 26 (Round to three decimal places as needed.)
Step by Step Solution
There are 3 Steps involved in it
1 Expert Approved Answer
Step: 1 Unlock

Question Has Been Solved by an Expert!
Get step-by-step solutions from verified subject matter experts
Step: 2 Unlock
Step: 3 Unlock