

Question: Complete parts (a) through (h) for the data below. 75 40 71 64 60 50 (a) By hand, draw a scatter diagram treating x as
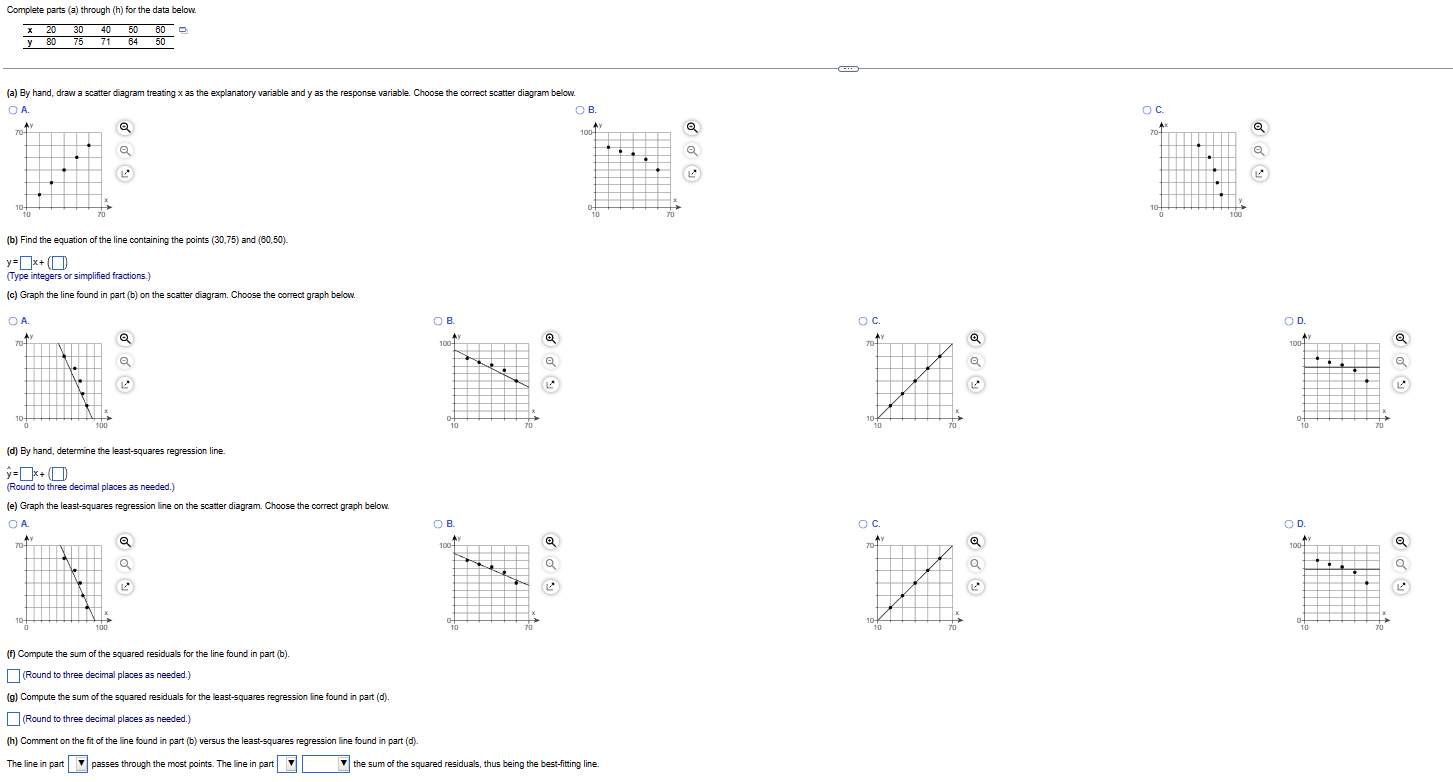
Complete parts (a) through (h) for the data below. 75 40 71 64 60 50 (a) By hand, draw a scatter diagram treating x as the explanatory variable and y as the response variable. Choose the correct scatter diagram below. OA O B. OC (b) Find the equation of the line containing the points (30,75) and (80,50). y=[*+(0) (Type integers or simplified fractions.) (c) Graph the line found in part (b) on the scatter diagram. Choose the correct graph below. OA B. DC. 100 O D. 100 70 (d) By hand, determine the least-squares regression line. y=[x+0) (Round to three decimal places as needed.) (e) Graph the least-squares regression line on the scatter diagram. Choose the correct graph below. O A. DB. DC. 100- D 1001 70 (f) Compute the sum of the squared residuals for the line found in part (b). (Round to three decimal places as needed.) (g) Compute the sum of the squared residuals for the least-squares regression line found in part (d). (Round to three decimal places as needed.) (h) Comment on the fit of the line found in part (b) versus the least-squares regression line found in part (d) The line in part V passes through the most points. The line in part the sum of the squared residuals, thus being the best-fitting line
Step by Step Solution
There are 3 Steps involved in it

Get step-by-step solutions from verified subject matter experts