

Question: complete right table??? Question Help A library took a survey to find the age distribution of 50 randomly (a) Use proportions to construct a relative
complete right table???
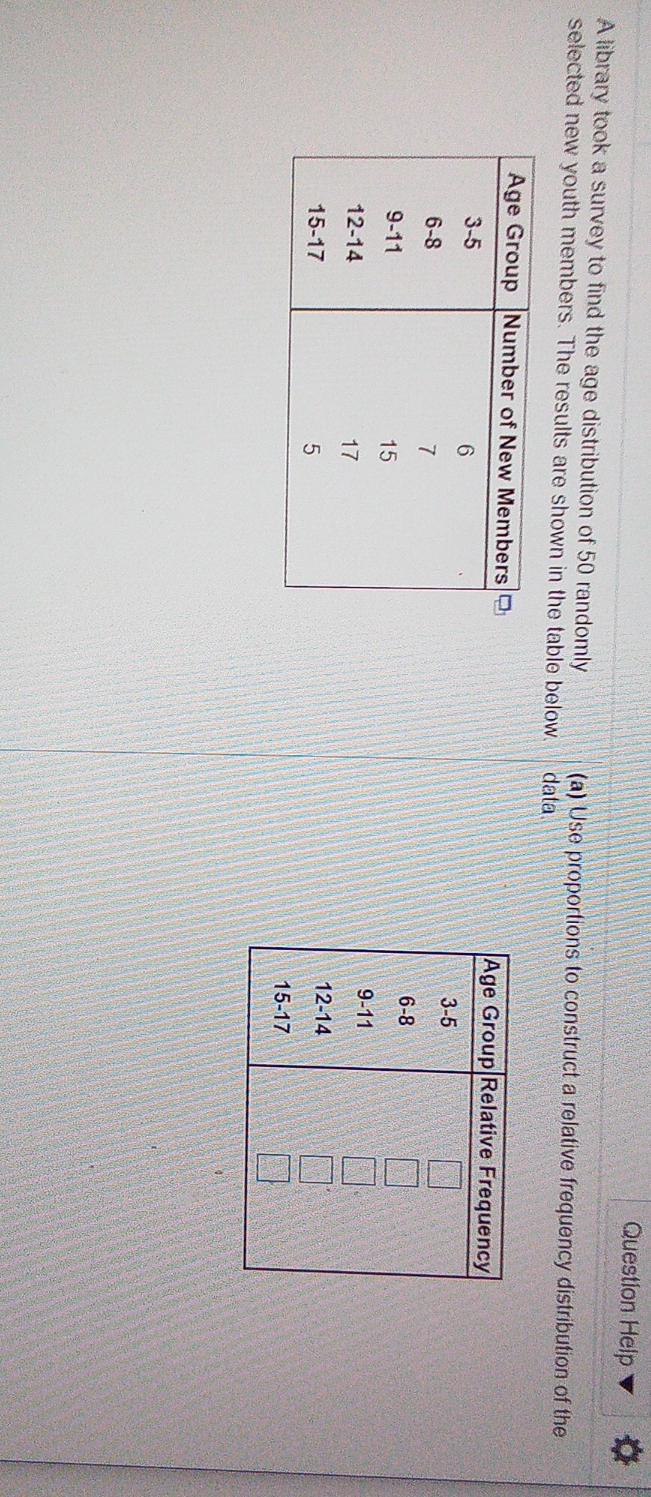
Question Help A library took a survey to find the age distribution of 50 randomly (a) Use proportions to construct a relative frequency distribution of the selected new youth members. The results are shown in the table below. data Age Group Number of New Members Q Age Group Relative Frequency 6-8 6-8 9-11 9-11 12-14 12-14 15-17 15-17
Step by Step Solution
There are 3 Steps involved in it
1 Expert Approved Answer
Step: 1 Unlock

Question Has Been Solved by an Expert!
Get step-by-step solutions from verified subject matter experts
Step: 2 Unlock
Step: 3 Unlock