

Question: Complete table 2.3 and Figure 2.3 provided in the appendix. Attach the completed table and figure as response to this question. The correctly completed table
Tables 2.2 and 2.3 are provided in the attachment.
A table (2.3) and a log-lin template for the graph (figure 2.3) you need to complete is provided in the attachment.
- Using the data provided in Table 2.2, complete Table 2.3 by calculating the relative concentration (concrei) values for(i) mantle (peridotite) rocks, (ii) oceanic crust rocks, and (iii) continental crust rocks, compared with carbonaceous chondrite composition. Indicate whether each of the calculated values represents relative enrichment or relative depletion for the different elements in the terrestrial rocks. Express your results to no more than 3 significant figures.
- Plot your results from Table 2.3 on the graph in Figure 2.3. Consider Cr, Ni, K and Ti as ppm values only. Data forchondrite normalized ocean crust, together with the first two points for chondrite normalized peridotite (mantle) and continental crust, have already been plotted. The order of elements has been chosen to illustrate the main differences and similarities in these three chondrite normalized (i.e. spidergram) patterns.
- What can you deduce must have happened to the element distribution within the Earth since its condensation and accretion from the solar nebula?
PLEASE MOST HELP WITH TABLE AND GRAPH
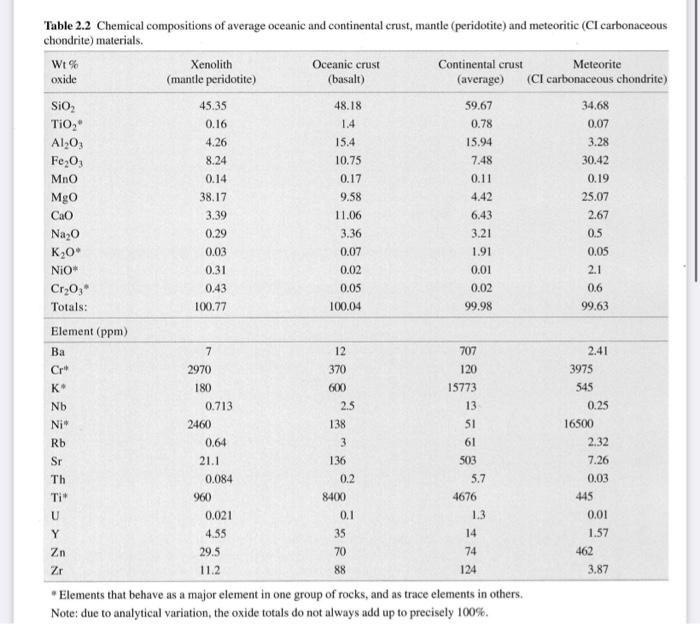
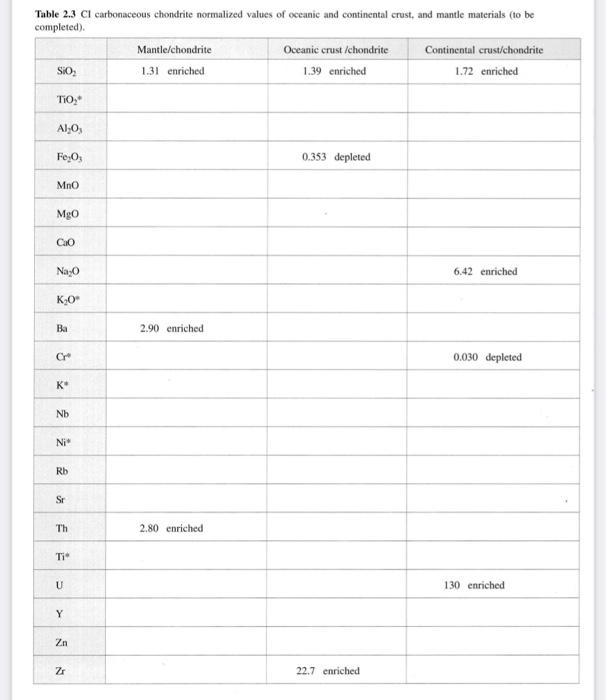
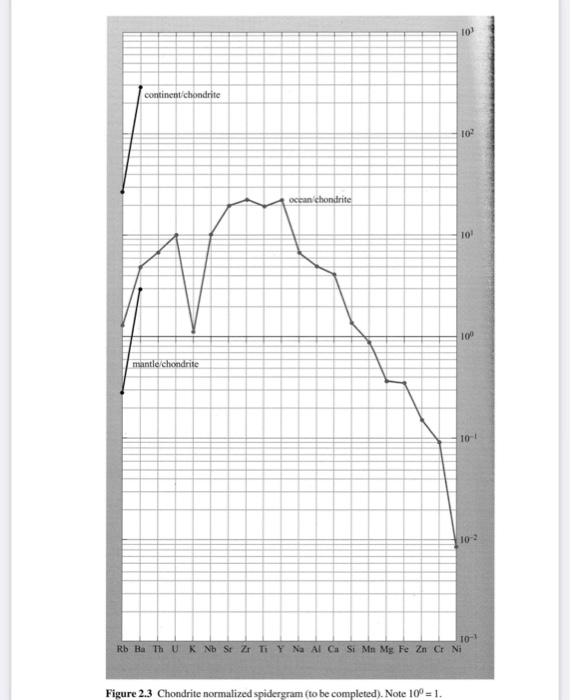
Note: due to analytical variation, the oxide totals do not always add up to precisely 100%. Figure 2.3 Chondrite normalized spidergram (to be completed). Note 10=1. Table 2.3Cl carbonaceous chondrite normalized values of oceanic and continental crust, and mantle materials (to be completed). \begin{tabular}{|c|c|c|c|} \hline & Mantle/chondrite & Oceanic crust/chondrite & Continental crust/chondrite \\ \hline SiO2 & 1.31 enriched & 1.39 enriched & 1.72 enriched \\ \hline \multicolumn{4}{|l|}{TiO2} \\ \hline \multicolumn{4}{|l|}{Al2O3} \\ \hline Fe2O3 & & 0.353 depleted & \\ \hline \multicolumn{4}{|l|}{MnO} \\ \hline MgO & & & \\ \hline \multicolumn{4}{|l|}{CrO} \\ \hline Na2O & & & 6.42 enriched \\ \hline \multicolumn{4}{|l|}{K2O} \\ \hline Ba & 2.90 enriched & & \\ \hline Cr & & & 0.030 depleted \\ \hline \multicolumn{4}{|l|}{K} \\ \hline \multicolumn{4}{|l|}{Nb} \\ \hline \multicolumn{4}{|l|}{Ni} \\ \hline \multicolumn{4}{|l|}{Rb} \\ \hline Sr & & & \\ \hline Th & 2.80 enriched & & \\ \hline \multicolumn{4}{|l|}{Ti} \\ \hline U & & & 130 enriched \\ \hline \multicolumn{4}{|l|}{Y} \\ \hline \multicolumn{4}{|l|}{Zn} \\ \hline Zr & & 22.7 enriched & \\ \hline \end{tabular}
Step by Step Solution
There are 3 Steps involved in it

Get step-by-step solutions from verified subject matter experts