

Question: Complete the analytics (common-size, growth, ratios) for the historical years. Forecast the financial statements and cash flows based on reasoning you can connect to the
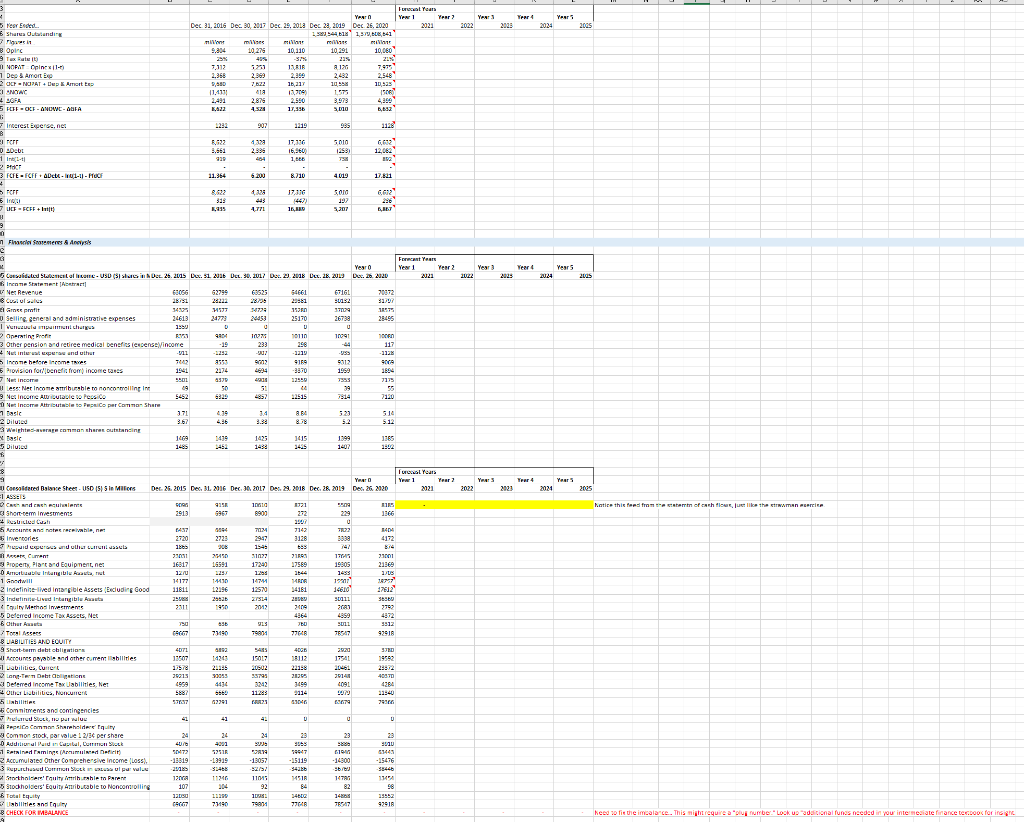
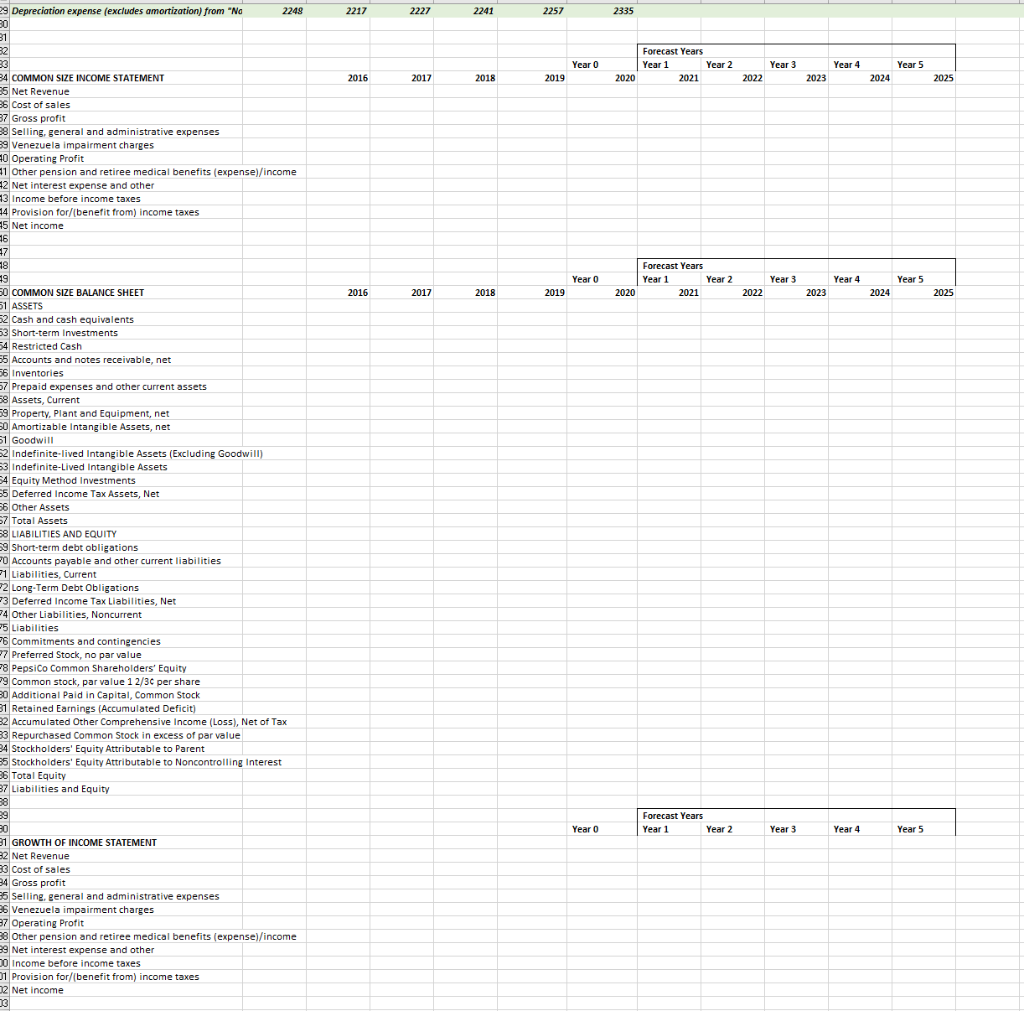
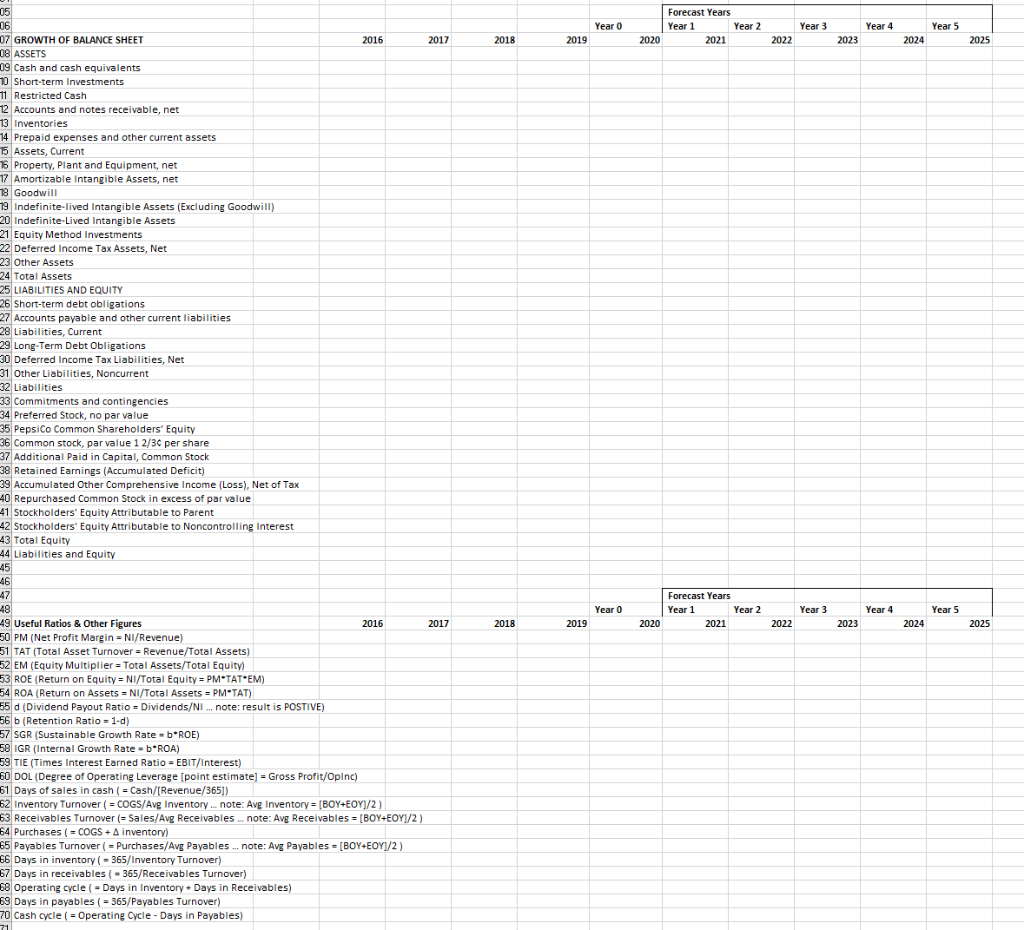
Complete the analytics (common-size, growth, ratios) for the historical years.
Forecast the financial statements and cash flows based on reasoning you can connect to the historical information. I recommend starting with a prediction of sales growth. Forecast other items at the same rate unless some other assumption makes more sense. Remember, not everything will grow at the same rate as revenue.
Complete the analytics (common-size, growth, ratios) for five forecast years.
Complete the cash flow computations area.
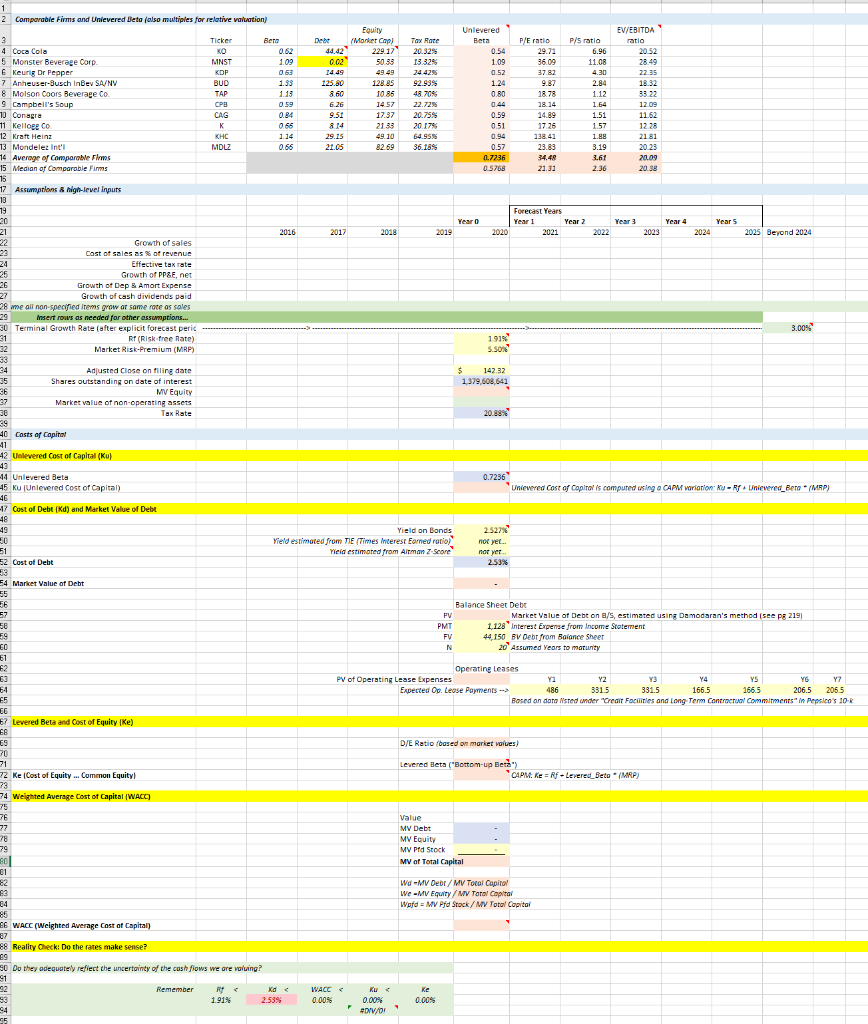
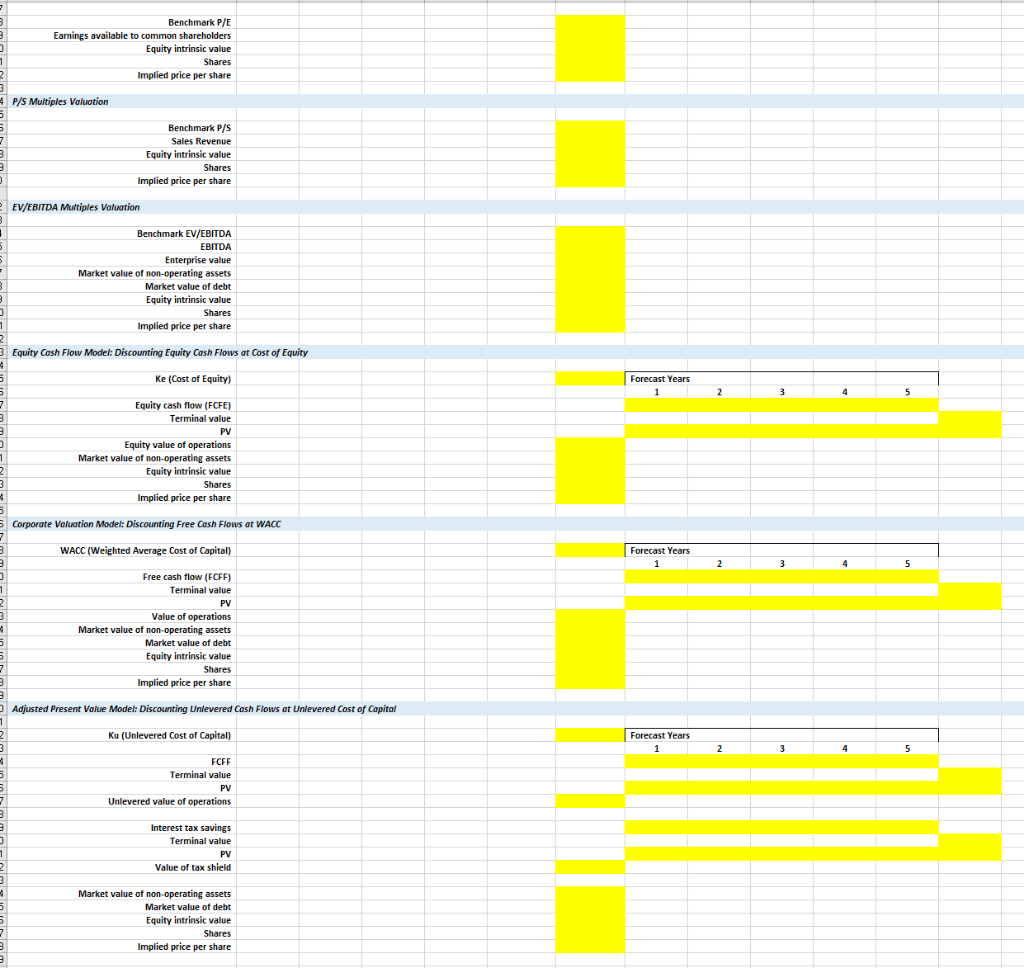
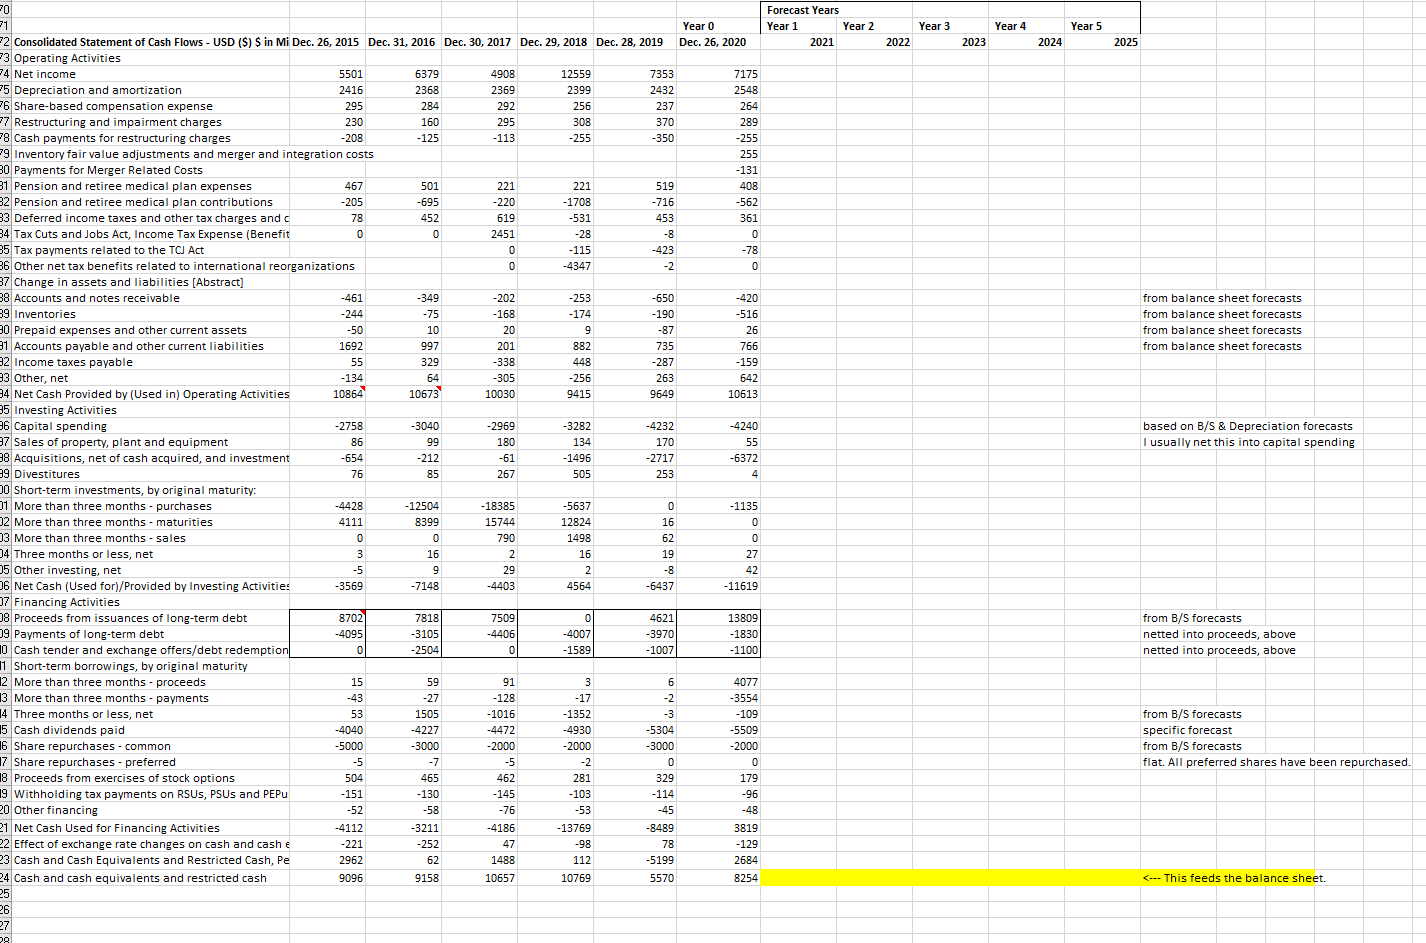
1 2 Comparable Firms and Unlevered Beta (also multiples for relative valuation) EV/EBITDA Tax Rate 20.325 13.32% 20.52 Ticker KO MNST KDP BUD TAP CPB CAG K KHC MDLZ Unlevered Beta 0.54 1.09 0.52 1.24 0.80 3 4 Coca Cola 5 Monster Beverage Corp E keurig Dr Pepper 7 Anheuser-Busch InBev SA/NV & Molson Coors Beverage Co. 9 Campbell's soup 10 Conagre 11 Kellogg Co 12 Kraft Heinz 13 Mondelez Int'l 14 Average of comparable Firms 15 Medion of comparable Firms 75 17 Assumptions & High-level inputs 13 79 20 Equity Debe Marker Cop) 44.42 229 17 0.0 50.33 14.49 125.00 128.85 8.60 10.86 6.26 14.57 9.51 17.37 8.14 2133 29.15 49.10 21.05 82.69 P/E ratio 29.22 36.09 37.82 9.87 18.78 0.62 1.09 0.63 133 113 0.59 0.84 0.55 1.14 0.66 18.14 92.935 48.709 22.7295 20.75 2017 64.95 36.18% P/S ratio 6.96 11.08 4.30 2.84 1.12 1.64 1.51 1.57 1.88 3.19 3.61 2.36 0.59 0.51 14.89 17.26 138.42 23.83 34.48 21.31 22 35 18.32 33 22 12.09 11.52 1228 21.81 20.23 20.09 20.38 0.57 0.7236 0.5768 Year o Forecast Years Year 1 Year 2 2021 Year Year 4 Year 5 2016 2017 2018 2019 2020 2022 2023 2024 2025 Beyond 2024 3.00% 22 Growth of sales Cost of sales as of revenus 24 Effective tax rate 25 Growth of PP&E.net 26 Growth of Dep & Amort Expense 27 Growth of cash dividends paid 28 me all non-specified items grow or same rate as sales 29 Insert rows as needed for other assumptions... 30 Terminal Growth Rete (after explicit forecast peric 31 RF (Risk Pree Rate) 32 Market Risk-Premium (MRP) 33 34 Adjusted Close on filing date Shares outstanding on date of interest 36 MV Equity Market value of non-operating assets 38 Tax Rate 39 40 costs of Capital 1913 S.SOX $ 142.32 1,379,608,641 20.88% -12 Unlevered Cost of Capital (Kul 0.7236 Unlevered Cost of Capital is computed using a CAPM variation Ku-Rf Unlevered_Bero (MRP) 14 Unlevered Beta 45 Ku (Unlevered Cost of Capital) 46 -17 Cost of Debt (d) and Market Value of Debt 48 Yield on Bonds Yield estimated from TIE (Times Interest Eored ratio) Yield estimated from Arman Z Score 2.522 not yet not yet 2.53% 30 51 52 Cost of Debt 53 E4 Market Value of Debt 55 56 58 Balance Sheer Debt PV Market Value of Debt on a/s, estimated using Damodaran's method (see pg 2191 PMT 1,128 Interest Expense from Income Statement FV 44,150 BV Debt from Balance Sheer N 20 Assumed Years to maturity CO 51 Operating Leases PV of Operating Lease Expenses Y2 Y3 Y4 YS YG Y? Expected Op. Leose Payments --> 486 3315 331.5 1665 166.5 206.5 2055 Based on data listed under Credit Facilities and Long-Term Contractual commitments in Pepsico's 10-R D/E Ratio (based on market values) 54 65 LE 67 Levered Beta and Cost of Equity (Ke) 68 ES 70 71 72 Ke (Cost of Equity ... Common Equity 73 74 Weighted Average cost of Capital (WACC) 75 76 77 78 79 80 Levered Beta ("Bottom-up Beta CAPM. Ke=RLevered Beta (MP) Value MV Debt MV Equity MV Pra Stock MV of Total Capital 93 Wd - MV Debr/MV Tocal Capito We MV Equity / MV Toral Capital Word = MV Prd Stock /MV Total Capital 25 BE WACC (Weighted Average Cost of Capital) 68 Reality Check: Do the rates make sense? 99 50 Do they adequately reflect the uncertainty of the cash flows we are voluing? 91 Remember RT 93 1.91% 2.53% 94 Ka WACC 0.00% ke 0.00% 0.00% #DIV/0! 3 3 Benchmark P/E Earnings available to common shareholders Equity intrinsic value Shares Implied price per share 1 P/S Multiples Valuation 7 3 3 Benchmark P/S PS Sales Revenue Equity intrinsic value Shares Implied price per share EV/EBITDA Multiples Valuation 5 Benchmark EV/EBITDA EBITDA Enterprise value Market value of non-operating assets Market value of debt Equity intrinsic value Shares Implied price per share 3 3 ] 1 Forecast Years 1 2 3 4 5 3 Equity Cash Flow Model: Discounting Equity Cash Flows at Cost of Equity 4 5 Ke (Cost of Equity) 5 7 Equity cash flow (FCFE) 3 Terminal value 3 PV Equity value of operations 1 Market value of non-operating assets Equity intrinsic value Shares 4 Implied price per share Corporate Valuation Model: Discounting Free Cash Flows at WACC 7 3 3 WACC (Weighted Average Cost of Capital) Forecast Years 1 2 3 5 Free cash flow (FCFF) Terminal value 1 2 3 PV Value of operations Market value of non-operating assets Market value of debt Equity intrinsic value Shares Implied price per share 7 Adjusted Present Value Model: Discounting Unlevered Cash Flows at Unlevered Cost of Capital Ku (Unlevered Cost of Capital) ) 1 2 3 1 5 Forecast Years 1 2 5 FCFF Terminal value PV Unlevered value of operations 7 3 3 ) 1 Interest tax savings Terminal value PV Value of tax shield 1 Market value of non-operating assets Market value of debt Equity intrinsic value Shares Implied price per share 3 lear 2013 1 A. SE. 2015 100, 51, 2016 p. 14, 2017 241, 28 218 Ter, 26, 2013 , 20 2 Forecast Years Year 1 Year 2 2021 Year 3 Year 4 Year o Dec. 26, 2020 Year 5 2022 2023 2024 2025 7175 2548 264 200 289 ser -255 BEE 255 10 -131 200 408 TES -562 361 0 20 -78 0 B9 Inventories -420 -516 ac 26 from balance sheet forecasts from balance sheet forecasts from balance sheet forecasts from balance sheet forecasts -87 766 -159 642 10613 30 21 2 Consolidated Statement of Cash Flows - USD ($) $ in Mi Dec. 26, 2015 Dec. 31, 2016 Dec. 30, 2017 Dec. 29, 2018 Dec. 28, 2019 F3 Operating Activities 94 Net income 5501 6379 4908 12559 7353 75 Der 5 Depreciation and amortization 2416 2368 2369 2399 2432 26 Share-based compensation expense 295 284 292 256 237 27 Restructuring and impairment charges 230 160 295 308 370 8 Cash payments for restructuring charges -208 -125 -113 -255 -350 19 Inventory fair value adjustments and merger and integration costs 30 Payments for Merger Related Costs 31 Pension and retiree medical plan expenses 467 501 221 221 519 32 Pension and retiree medical plan contributions -205 -695 -220 -1708 -716 33 Deferred income taxes and other tax charges and 78 452 619 -531 453 34 Tax Cuts and Jobs Act, Income Tax Expense (Benefit 0 0 0 2451 -28 -8 35 Tax payments related to the TCJ Act 0 -115 -423 36 Other net tax benefits related to international reorganizations 0 -4347 -2 37 Change in assets and liabilities [Abstract] 38 Accounts and notes receivable -461 -349 -202 -253 -650 -244 -75 -168 -174 -190 an Drennid 80 Prepaid expenses and other current assets -50 10 20 9 91 Accounts payable and other current liabilities 00 1692 997 201 882 735 22 82 Income taxes payable 55 329 -338 448 -287 33 Other, net - 134 64 -305 263 -256 263 24 Net Cash Provided by (Used in) Operating Activities 10864 0610 10673 10030 9415 9649 35 Investing Activities 36 Capital spending -2758 -3040 -2969 -3282 -4232 37 Sales of property, plant and equipment 86 99 180 134 170 38 Acquisitions, net of cash acquired, and investment -654 -212 -61 -1496 -2717 39 Divestitures 76 85 267 ve 505 253 DO Short-term investments, by original maturity: 01 More than three months - purchases -4428 -12504 -18385 -5637 0 0 02 More than three months - maturities 4111 8399 15744 12824 16 03 More than three months - sales 0 0 0 790 1498 62 14 Three months or less, net 3 16 2 16 19 men 5 Other investing, net -5 9 29 2 2 -8 06 Net Cash (Used for)/Provided by Investing Activities -3569 -7148 -4403 4564 -6437 07 Financing Activities 08 Proceeds from issuances of long-term debt 8702 7818 7509 0 4621 09 Payments of long-term debt -4095 -3105 -4406 -4007 -3970 0 cash tender and exchange offers/debt redemption 0 -2504 0 - 1589 -1007 11 Short-term borrowings, by original maturity 12 More than three months - proceeds 15 59 91 3 6 13 More than three months - payments -43 -27 -128 -17 -2 14 Three months or less, net 53 1505 -1016 - 1352 -3 15 Cash dividends paid 5 -4040 -4227 -4472 -4930 -5304 16 Share repurchases - common Purchase - -5000 -3000 -2000 -2000 -3000 17 Share repurchases - preferred -5 -7 -5 -2 0 18 Proceeds from exercises of stock options 504 465 462 281 329 19 Withholding tax payments on RSUS, PSUs and PEPU -151 -130 -145 - 103 -114 20 Other financing -52 -58 -76 -53 -45 21 Net Cash Used for Financing Activities -4112 -3211 -4186 -13769 -8489 22 Effect of exchange rate changes on cash and cash e -221 -252 47 -98 78 23 Cash and Cash Equivalents and Restricted Cash, Pe 2962 62 1488 112 -5199 24 Cash and cash equivalents and restricted cash 9096 9158 10657 10769 5570 25 26 27 28 -4240 55 -6372 4. based on B/S & Depreciation forecasts I usually net this into capital spending -1135 0 0 27 42 - 11619 13809 -1830 -1100 from B/S forecasts netted into proceeds, above netted into proceeds, above from B/S forecasts specific forecast from B/S forecasts flat. All preferred shares have been repurchased. 4077 -3554 -109 -5509 -2000 0 179 -96 -48 3819 - 129 2684 8254 486 3315 331.5 1665 166.5 206.5 2055 Based on data listed under Credit Facilities and Long-Term Contractual commitments in Pepsico's 10-R D/E Ratio (based on market values) 54 65 LE 67 Levered Beta and Cost of Equity (Ke) 68 ES 70 71 72 Ke (Cost of Equity ... Common Equity 73 74 Weighted Average cost of Capital (WACC) 75 76 77 78 79 80 Levered Beta ("Bottom-up Beta CAPM. Ke=RLevered Beta (MP) Value MV Debt MV Equity MV Pra Stock MV of Total Capital 93 Wd - MV Debr/MV Tocal Capito We MV Equity / MV Toral Capital Word = MV Prd Stock /MV Total Capital 25 BE WACC (Weighted Average Cost of Capital) 68 Reality Check: Do the rates make sense? 99 50 Do they adequately reflect the uncertainty of the cash flows we are voluing? 91 Remember RT 93 1.91% 2.53% 94 Ka WACC 0.00% ke 0.00% 0.00% #DIV/0! 3 3 Benchmark P/E Earnings available to common shareholders Equity intrinsic value Shares Implied price per share 1 P/S Multiples Valuation 7 3 3 Benchmark P/S PS Sales Revenue Equity intrinsic value Shares Implied price per share EV/EBITDA Multiples Valuation 5 Benchmark EV/EBITDA EBITDA Enterprise value Market value of non-operating assets Market value of debt Equity intrinsic value Shares Implied price per share 3 3 ] 1 Forecast Years 1 2 3 4 5 3 Equity Cash Flow Model: Discounting Equity Cash Flows at Cost of Equity 4 5 Ke (Cost of Equity) 5 7 Equity cash flow (FCFE) 3 Terminal value 3 PV Equity value of operations 1 Market value of non-operating assets Equity intrinsic value Shares 4 Implied price per share Corporate Valuation Model: Discounting Free Cash Flows at WACC 7 3 3 WACC (Weighted Average Cost of Capital) Forecast Years 1 2 3 5 Free cash flow (FCFF) Terminal value 1 2 3 PV Value of operations Market value of non-operating assets Market value of debt Equity intrinsic value Shares Implied price per share 7 Adjusted Present Value Model: Discounting Unlevered Cash Flows at Unlevered Cost of Capital Ku (Unlevered Cost of Capital) ) 1 2 3 1 5 Forecast Years 1 2 5 FCFF Terminal value PV Unlevered value of operations 7 3 3 ) 1 Interest tax savings Terminal value PV Value of tax shield 1 Market value of non-operating assets Market value of debt Equity intrinsic value Shares Implied price per share 3 lear 2013 1 A. SE. 2015 100, 51, 2016 p. 14, 2017 241, 28 218 Ter, 26, 2013 , 20 2 Forecast Years Year 1 Year 2 2021 Year 3 Year 4 Year o Dec. 26, 2020 Year 5 2022 2023 2024 2025 7175 2548 264 200 289 ser -255 BEE 255 10 -131 200 408 TES -562 361 0 20 -78 0 B9 Inventories -420 -516 ac 26 from balance sheet forecasts from balance sheet forecasts from balance sheet forecasts from balance sheet forecasts -87 766 -159 642 10613 30 21 2 Consolidated Statement of Cash Flows - USD ($) $ in Mi Dec. 26, 2015 Dec. 31, 2016 Dec. 30, 2017 Dec. 29, 2018 Dec. 28, 2019 F3 Operating Activities 94 Net income 5501 6379 4908 12559 7353 75 Der 5 Depreciation and amortization 2416 2368 2369 2399 2432 26 Share-based compensation expense 295 284 292 256 237 27 Restructuring and impairment charges 230 160 295 308 370 8 Cash payments for restructuring charges -208 -125 -113 -255 -350 19 Inventory fair value adjustments and merger and integration costs 30 Payments for Merger Related Costs 31 Pension and retiree medical plan expenses 467 501 221 221 519 32 Pension and retiree medical plan contributions -205 -695 -220 -1708 -716 33 Deferred income taxes and other tax charges and 78 452 619 -531 453 34 Tax Cuts and Jobs Act, Income Tax Expense (Benefit 0 0 0 2451 -28 -8 35 Tax payments related to the TCJ Act 0 -115 -423 36 Other net tax benefits related to international reorganizations 0 -4347 -2 37 Change in assets and liabilities [Abstract] 38 Accounts and notes receivable -461 -349 -202 -253 -650 -244 -75 -168 -174 -190 an Drennid 80 Prepaid expenses and other current assets -50 10 20 9 91 Accounts payable and other current liabilities 00 1692 997 201 882 735 22 82 Income taxes payable 55 329 -338 448 -287 33 Other, net - 134 64 -305 263 -256 263 24 Net Cash Provided by (Used in) Operating Activities 10864 0610 10673 10030 9415 9649 35 Investing Activities 36 Capital spending -2758 -3040 -2969 -3282 -4232 37 Sales of property, plant and equipment 86 99 180 134 170 38 Acquisitions, net of cash acquired, and investment -654 -212 -61 -1496 -2717 39 Divestitures 76 85 267 ve 505 253 DO Short-term investments, by original maturity: 01 More than three months - purchases -4428 -12504 -18385 -5637 0 0 02 More than three months - maturities 4111 8399 15744 12824 16 03 More than three months - sales 0 0 0 790 1498 62 14 Three months or less, net 3 16 2 16 19 men 5 Other investing, net -5 9 29 2 2 -8 06 Net Cash (Used for)/Provided by Investing Activities -3569 -7148 -4403 4564 -6437 07 Financing Activities 08 Proceeds from issuances of long-term debt 8702 7818 7509 0 4621 09 Payments of long-term debt -4095 -3105 -4406 -4007 -3970 0 cash tender and exchange offers/debt redemption 0 -2504 0 - 1589 -1007 11 Short-term borrowings, by original maturity 12 More than three months - proceeds 15 59 91 3 6 13 More than three months - payments -43 -27 -128 -17 -2 14 Three months or less, net 53 1505 -1016 - 1352 -3 15 Cash dividends paid 5 -4040 -4227 -4472 -4930 -5304 16 Share repurchases - common Purchase - -5000 -3000 -2000 -2000 -3000 17 Share repurchases - preferred -5 -7 -5 -2 0 18 Proceeds from exercises of stock options 504 465 462 281 329 19 Withholding tax payments on RSUS, PSUs and PEPU -151 -130 -145 - 103 -114 20 Other financing -52 -58 -76 -53 -45 21 Net Cash Used for Financing Activities -4112 -3211 -4186 -13769 -8489 22 Effect of exchange rate changes on cash and cash e -221 -252 47 -98 78 23 Cash and Cash Equivalents and Restricted Cash, Pe 2962 62 1488 112 -5199 24 Cash and cash equivalents and restricted cash 9096 9158 10657 10769 5570 25 26 27 28 -4240 55 -6372 4. based on B/S & Depreciation forecasts I usually net this into capital spending -1135 0 0 27 42 - 11619 13809 -1830 -1100 from B/S forecasts netted into proceeds, above netted into proceeds, above from B/S forecasts specific forecast from B/S forecasts flat. All preferred shares have been repurchased. 4077 -3554 -109 -5509 -2000 0 179 -96 -48 3819 - 129 2684 8254
Step by Step Solution
There are 3 Steps involved in it

Get step-by-step solutions from verified subject matter experts