

Question: Complete the budget vs. actual report below using the data provided Circle Favorable or Unfavorable ACTUAL PLAN Difference $ $ Fav. Unfav. | A Sales
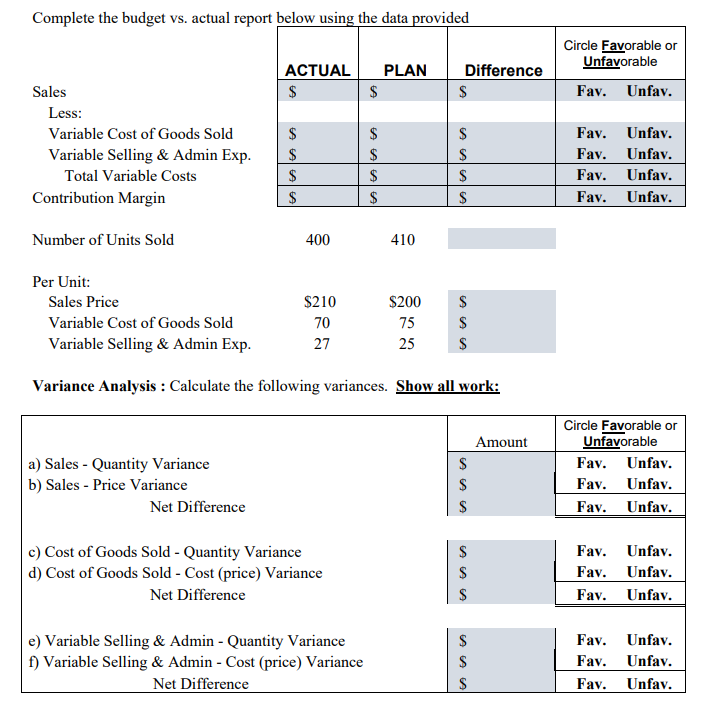
Complete the budget vs. actual report below using the data provided Circle Favorable or Unfavorable ACTUAL PLAN Difference $ $ Fav. Unfav. | A Sales Less: Variable Cost of Goods Sold Variable Selling & Admin Exp. Total Variable Costs Contribution Margin A| | na a A Fav. Fav. Fav. Fav. Unfav. Unfav. Unfav. Unfav. A| | 6 Number of Units Sold 400 410 S210 $200 A Per Unit: Sales Price Variable Cost of Goods Sold Variable Selling & Admin Exp. A 70 27 25 A Variance Analysis: Calculate the following variances. Show all work: Amount w a) Sales - Quantity Variance b) Sales - Price Variance Net Difference Circle Favorable or Unfavorable Fav. Unfav. Fav. Unfav. Fav. Unfav. w w a c) Cost of Goods Sold - Quantity Variance d) Cost of Goods Sold - Cost (price) Variance Net Difference s Fav. Fav. Fav. Unfav. Unfav. Unfav. w w e) Variable Selling & Admin - Quantity Variance f) Variable Selling & Admin - Cost (price) Variance Net Difference Fav. Fav. Fav. Unfav. Unfav. Unfav. a
Step by Step Solution
There are 3 Steps involved in it

Get step-by-step solutions from verified subject matter experts