

Question: Complete the equation below for an estimated regression equation developed to predict the average number of runs given up per inning pitched (R/IP) given the
Complete the equation below for an estimated regression equation developed to predict the average number of runs given up per inning pitched (R/IP) given the average number of strikeouts per inning pitched (SO/IP) and the average number of home runs per inning pitched (HR/IP) (to 3 decimals).
+ +
Use the test to determine the overall significance of the relationship.
Compute test statistic (to 2 decimals).
The -value is (to 3 decimals).
What is your conclusion at the .05 level of significance?
There
isis not a significant overall relationship.
Use the t test to determine the significance of each independent variable.
Compute the test statistic for the significance of SO/IP (to 2 decimals).
The -value is (to 3 decimals).
What is your conclusion at the .05 level of significance?
SO/IP
isis not significant.
Compute the test statistic for the significance of HR/IP (to 2 decimals).
The -value is (to 3 decimals).
What is your conclusion at the .05 level of significance?
HR/IP
isis not
- significant.
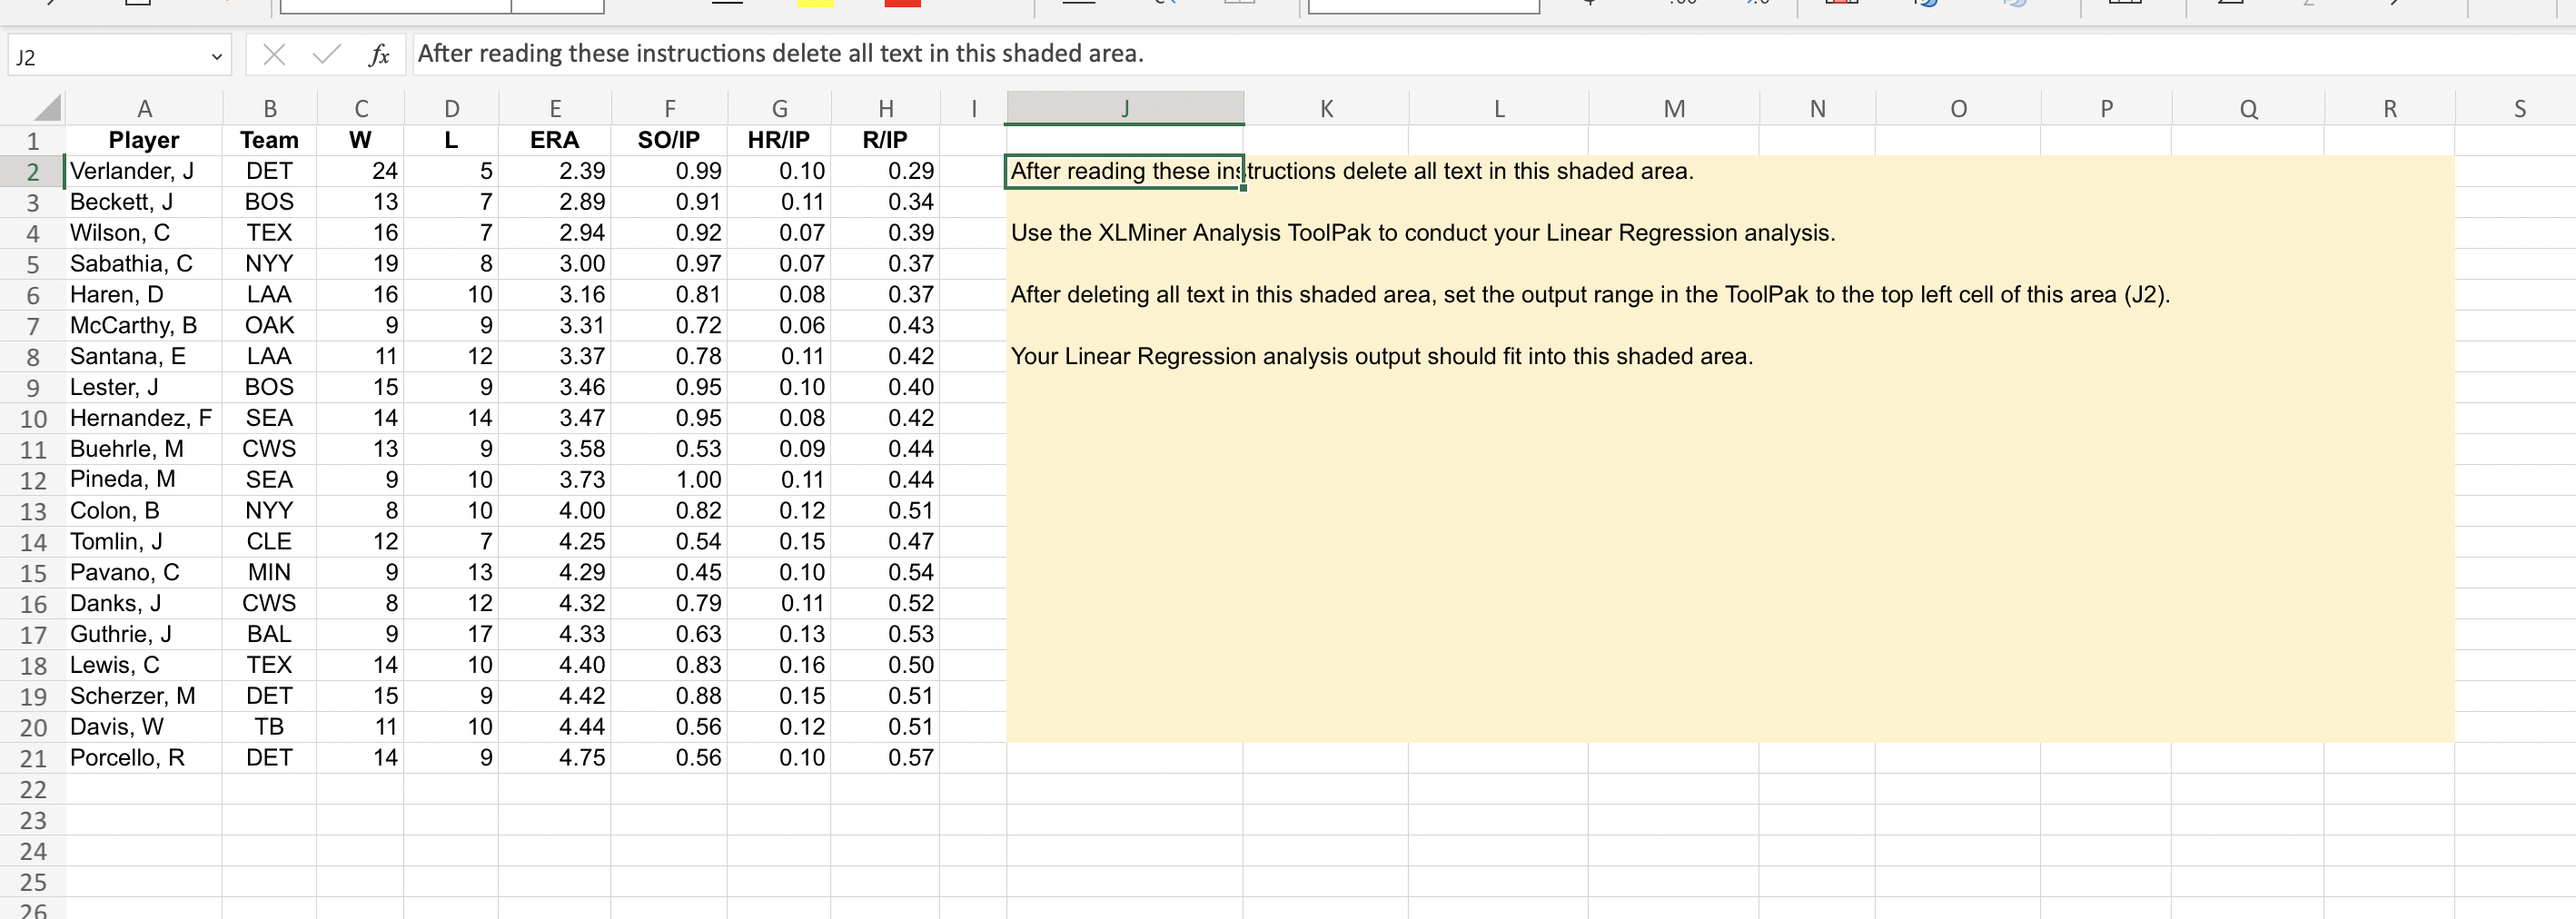
After reading these instructions delete all text in this shaded area. After reading these instructions delete all text in this shaded area. Use the XLMiner Analysis ToolPak to conduct your Linear Regression analysis. After deleting all text in this shaded area, set the output range in the ToolPak to the top left cell of this area (J2). Your Linear Regression analysis output should fit into this shaded area. After reading these instructions delete all text in this shaded area. After reading these instructions delete all text in this shaded area. Use the XLMiner Analysis ToolPak to conduct your Linear Regression analysis. After deleting all text in this shaded area, set the output range in the ToolPak to the top left cell of this area (J2). Your Linear Regression analysis output should fit into this shaded area
Step by Step Solution
There are 3 Steps involved in it

Get step-by-step solutions from verified subject matter experts