

Question: Complete the F table below using excel. Calculate the sum of squares (to 1 decimal) , the mean square (to 1 decimal) and the F
Complete the F table below using excel. Calculate the sum of squares (to 1 decimal) , the mean square (to 1 decimal) and the F ratio( to 2 decimals) and the p value (to 4 decimals)Source of variation Degree freedom Ssm ms. F. PvaluRegression - Error. -Total. -
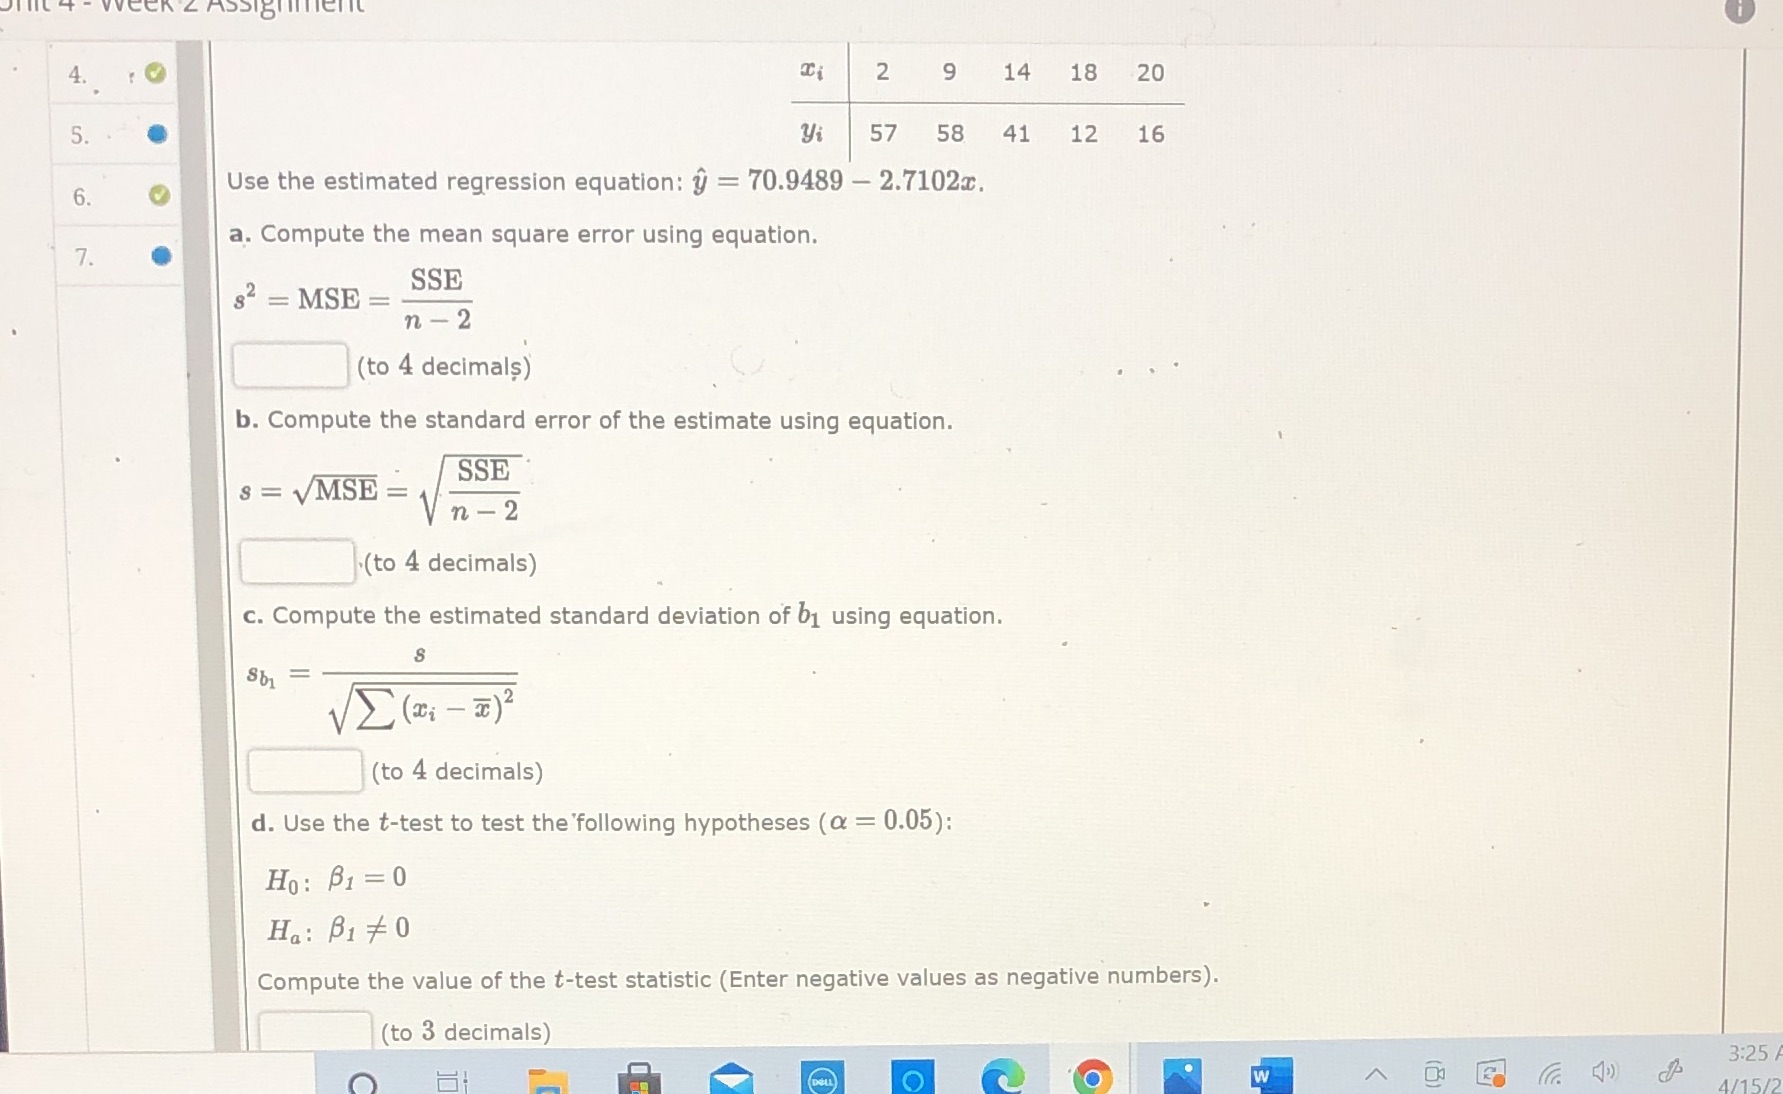
4. 2 9 14 18 20 5. yi 57 58 41 12 16 6. O Use the estimated regression equation: y = 70.9489 - 2.7102x. a. Compute the mean square error using equation. 7. SSE 82 = MSE = n - 2 (to 4 decimals) b. Compute the standard error of the estimate using equation. SSE S = VMSE = n - 2 (to 4 decimals) c. Compute the estimated standard deviation of b1 using equation. S Sb1 = VI ( Di - 2 ) 2 (to 4 decimals) d. Use the t-test to test the following hypotheses (a = 0.05): Ho : B1 = 0 Ha: B1 0 Compute the value of the t-test statistic (Enter negative values as negative numbers). (to 3 decimals) 3:25 w 15/2
Step by Step Solution
There are 3 Steps involved in it

Get step-by-step solutions from verified subject matter experts