

Question: -------------------------------------------------------------------------------------- -------------------------------------------------------------------------------------- Complete the flexible budget variance analysis by filling in the blanks in the partial flexible budget performance report for 11,000 travel locks for
--------------------------------------------------------------------------------------
--------------------------------------------------------------------------------------
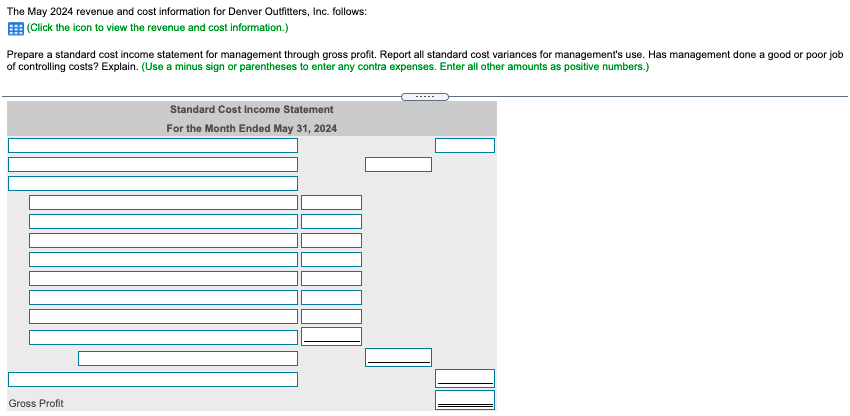
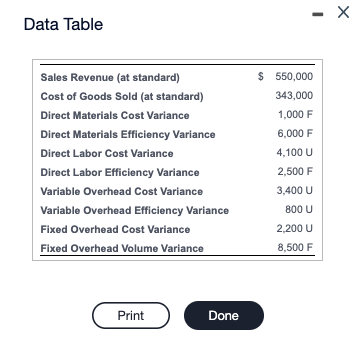
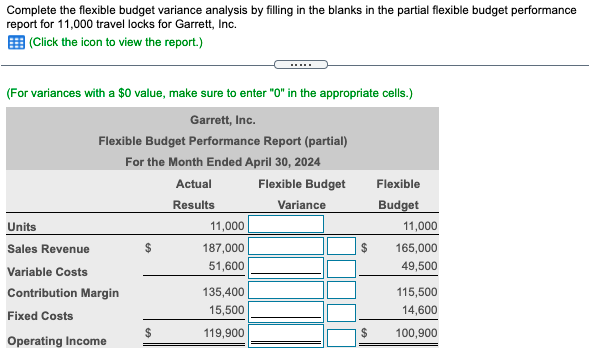
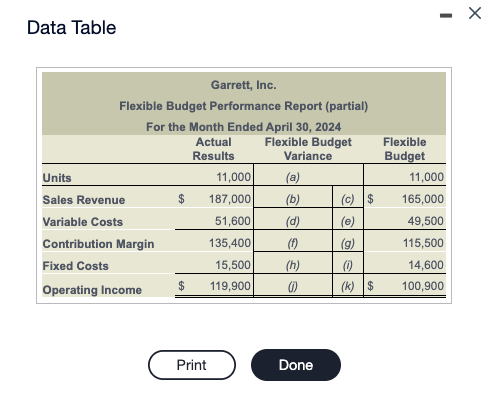
Complete the flexible budget variance analysis by filling in the blanks in the partial flexible budget performance report for 11,000 travel locks for Garrett, Inc. E (Click the icon to view the report.) (For variances with a $0 value, make sure to enter "0" in the appropriate cells.) Garrett, Inc. Flexible Budget Performance Report (partial) For the Month Ended April 30, 2024 Actual Flexible Budget Flexible Results Variance Budget Units 11,000 11,000 Sales Revenue 187,000 $ 165,000 Variable Costs 51,600 49,500 Contribution Margin 135,400 115,500 Fixed Costs 15,500 14,600 $ 119,900 100,900 Operating Income $ $ - Data Table Garrett, Inc. Flexible Budget Performance Report (partial) For the Month Ended April 30, 2024 Actual Flexible Budget Flexible Results Variance Budget Units 11,000 (a) 11,000 Sales Revenue $ 187,000 (b) (c) $ 165,000 Variable Costs 51,600 (d) (e) 49,500 Contribution Margin 135,400 (1) (9) 115,500 Fixed Costs 15,500 (h) (0) 14,600 Operating Income 119,900 0) (k) $ 100,900 Print Done The May 2024 revenue and cost information for Denver Outfitters, Inc. follows: Click the icon to view the revenue and cost information.) Prepare a standard cost income statement for management through gross profit. Report all standard cost variances for management's use. Has management done a good or poor job of controlling costs? Explain. (Use a minus sign or parentheses to enter any contra expenses. Enter all other amounts as positive numbers.) Standard Cost Income Statement For the Month Ended May 31, 2024 Gross Profit - X Data Table Sales Revenue (at standard) Cost of Goods Sold (at standard) Direct Materials Cost Variance Direct Materials Efficiency Variance Direct Labor Cost Variance Direct Labor Efficiency Variance Variable Overhead Cost Variance Variable Overhead Efficiency Variance Fixed Overhead Cost Variance Fixed Overhead Volume Variance $ 550,000 343,000 1,000 F 6.000 F 4,100 U 2,500 F 3,400 U 800 U 2,200 U 8,500 F Print Done
Step by Step Solution
There are 3 Steps involved in it

Get step-by-step solutions from verified subject matter experts