

Question: Complete the following four hypotheses, using = 0.05 for each. 1. Mean sales per week exceed 40.5 per salesperson 2. Proportion receiving online training is
Complete the following four hypotheses, using = 0.05 for each.
- 1. Mean sales per week exceed 40.5 per salesperson
- 2. Proportion receiving online training is less than 54%
- 3Mean calls made among those with no training is at least 140
- 4. The mean time per call is 14.7 minutes
- Using the same data set from part A, perform the hypothesis test for each speculation in order to see if there is evidence to support the manager's belief.
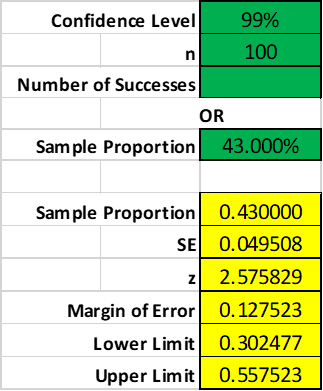
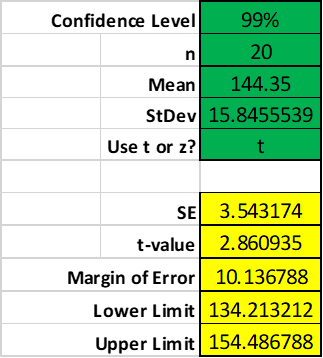
- Compute 99% confidence intervals for the variables used in each hypothesis test and interpret these intervals.
- Provide a report about the results, distilling down the results in a way that would be understandable to someone who does not know statistics. Clear explanations and interpretations are critical.
Part B: Hypothesis Testing and Confidence Interval
We shall look at four hypotheses of the manager for the set data and evaluate the information with a confidence interval of 99 %.
Hypothesis Test #1
Claim: Mean sales per week exceed 40.5 per salesperson
Step 1: H0a >40.5 (claim)
Step 2: Put information into the spreadsheet
Step 3: This is a right-tailedthe p-valueright-tailedthe p-value test, meaning that the error is on the right side of the distribution
Step 4: Determine p value. The right-sided p-value is 0.000028, which is less than alpha, our significance level.
| Level of Significance | 0.05 |
| Mean under H0 | 40.5 |
| n | 100 |
| Sample Mean | 43.63 |
| StDev | 7.44 |
| Use t or z? | t |
Step 3: This is a right tailed test, meaning that the error is on the right side of the distribution
Step 4: Determine p value. The right-sided p-value is 0.000028, which is less than alpha, our significance level.
| SE | 0.744000 |
| Test statistic | 4.206989 |
| Left-sided p-value | 0.999972 |
| Right-sided p-value | 0.000028 |
| Two-Sided p-value | 0.000026 |
Step 5: We reject H0 because p 0 because p
Confidence interval for hypothesis #1:
Now we determine if outhe 99% confidence interval reflects our result
| Confidence Level | 99% | |
| n | 100 | |
| Mean | 43.63 | |
| StDev | 7.44 | |
| Use t or z? | t | |
| SE | 0.744000 | |
| t-value | 2.626405 | |
| Margin of Error | 1.954046 | |
| Lower Limit | 41.675954 | |
| Upper Limit | 45.584046 |
According to our calculation, we are 99% confident that the actual mean sales per salesperson are between 41.68 and 45.58. Therefore, not only are our mean sales > 40.5 per salesperson, but there ia s 99% chance that they are actually between 42 and 46.
Hypothesis Test #2
Claim: Proportion of salesperson receiving online training is less than 54% out of all salesperson.
Step 1: H0> =54%; Ha
Step 2: Put information into the proportion side spreadsheet
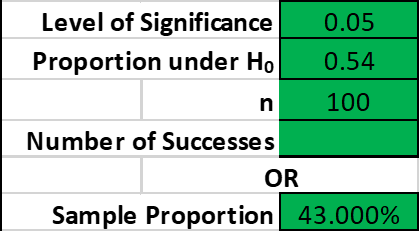
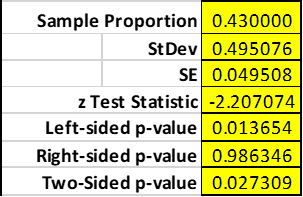
Level of Significance Proportion under Ho n Numbe r of Successes 0R Sample Proportion _ 0.430000 0.495076 0.049508 -2.207074 0.013654 0.986346 0.027309
Step by Step Solution
There are 3 Steps involved in it

Get step-by-step solutions from verified subject matter experts