

Question: Complete the following steps for the given function, interval, and value of n. a. Sketch the graph of the function on the given interval. b.


![[1,6]; n=5 . . . Ay 80- 80 7 80- 40- 40-](https://s3.amazonaws.com/si.experts.images/answers/2024/06/66659be643dd5_07866659be617384.jpg)
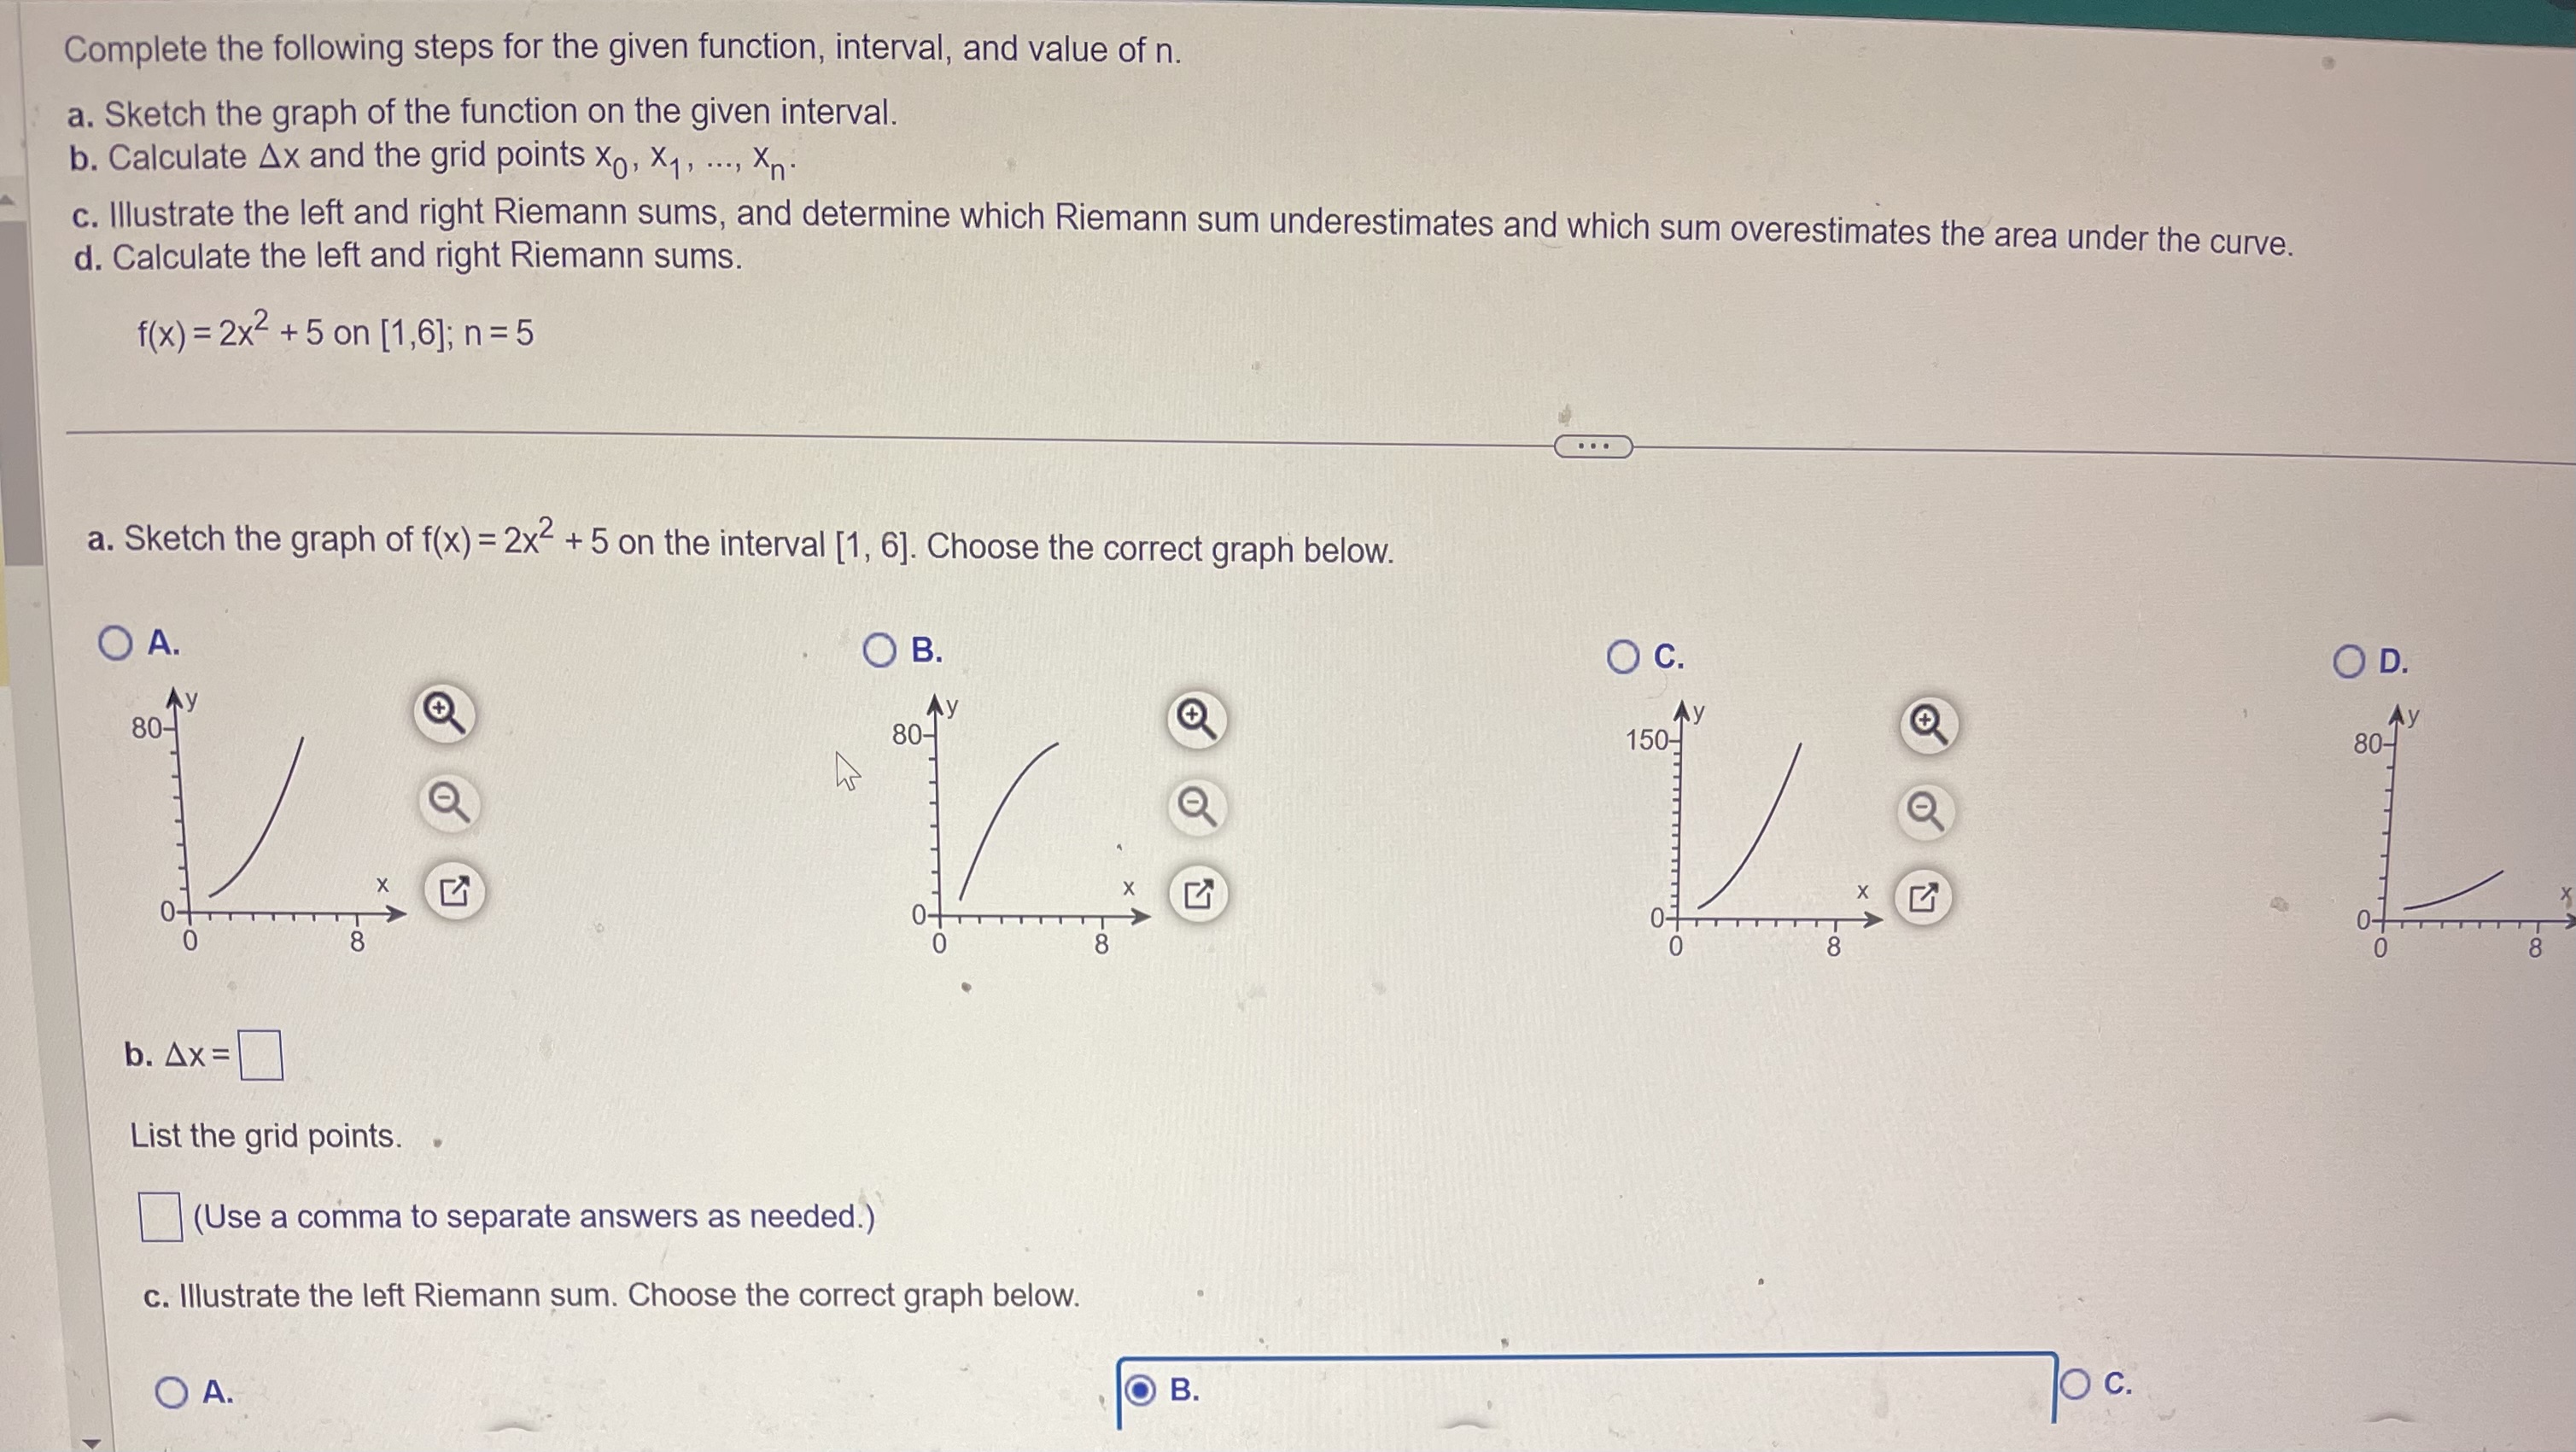
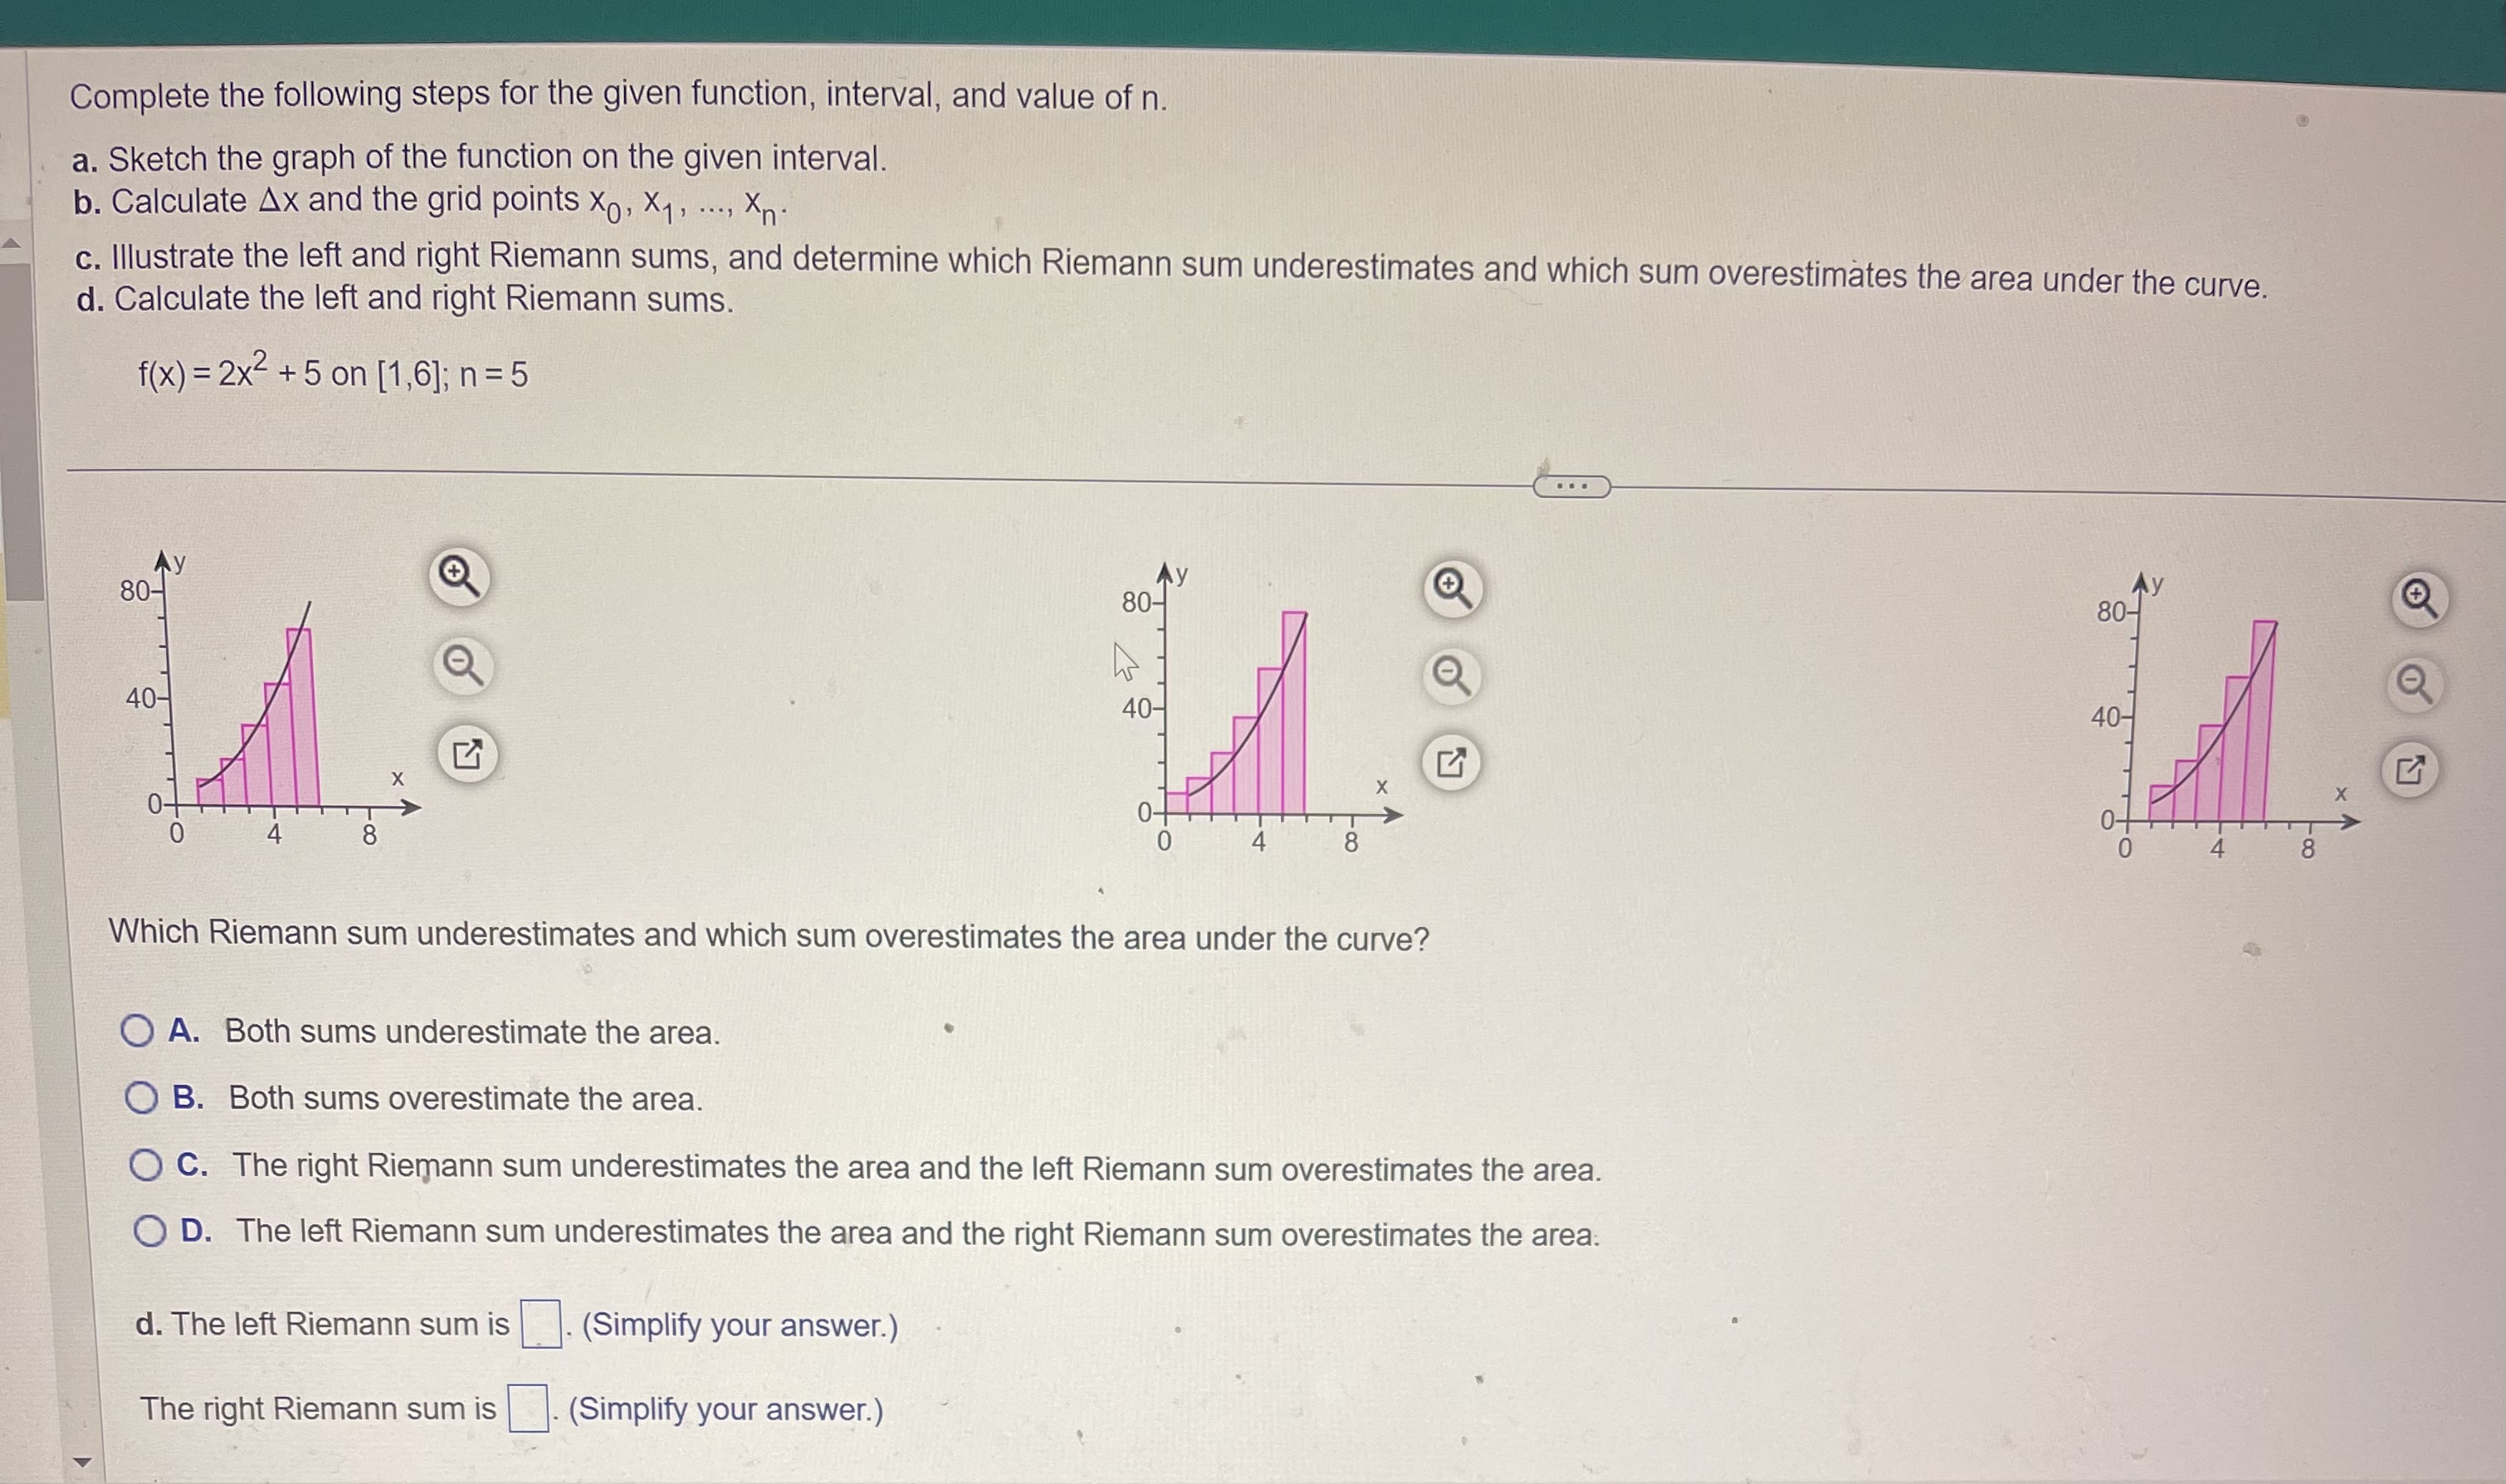
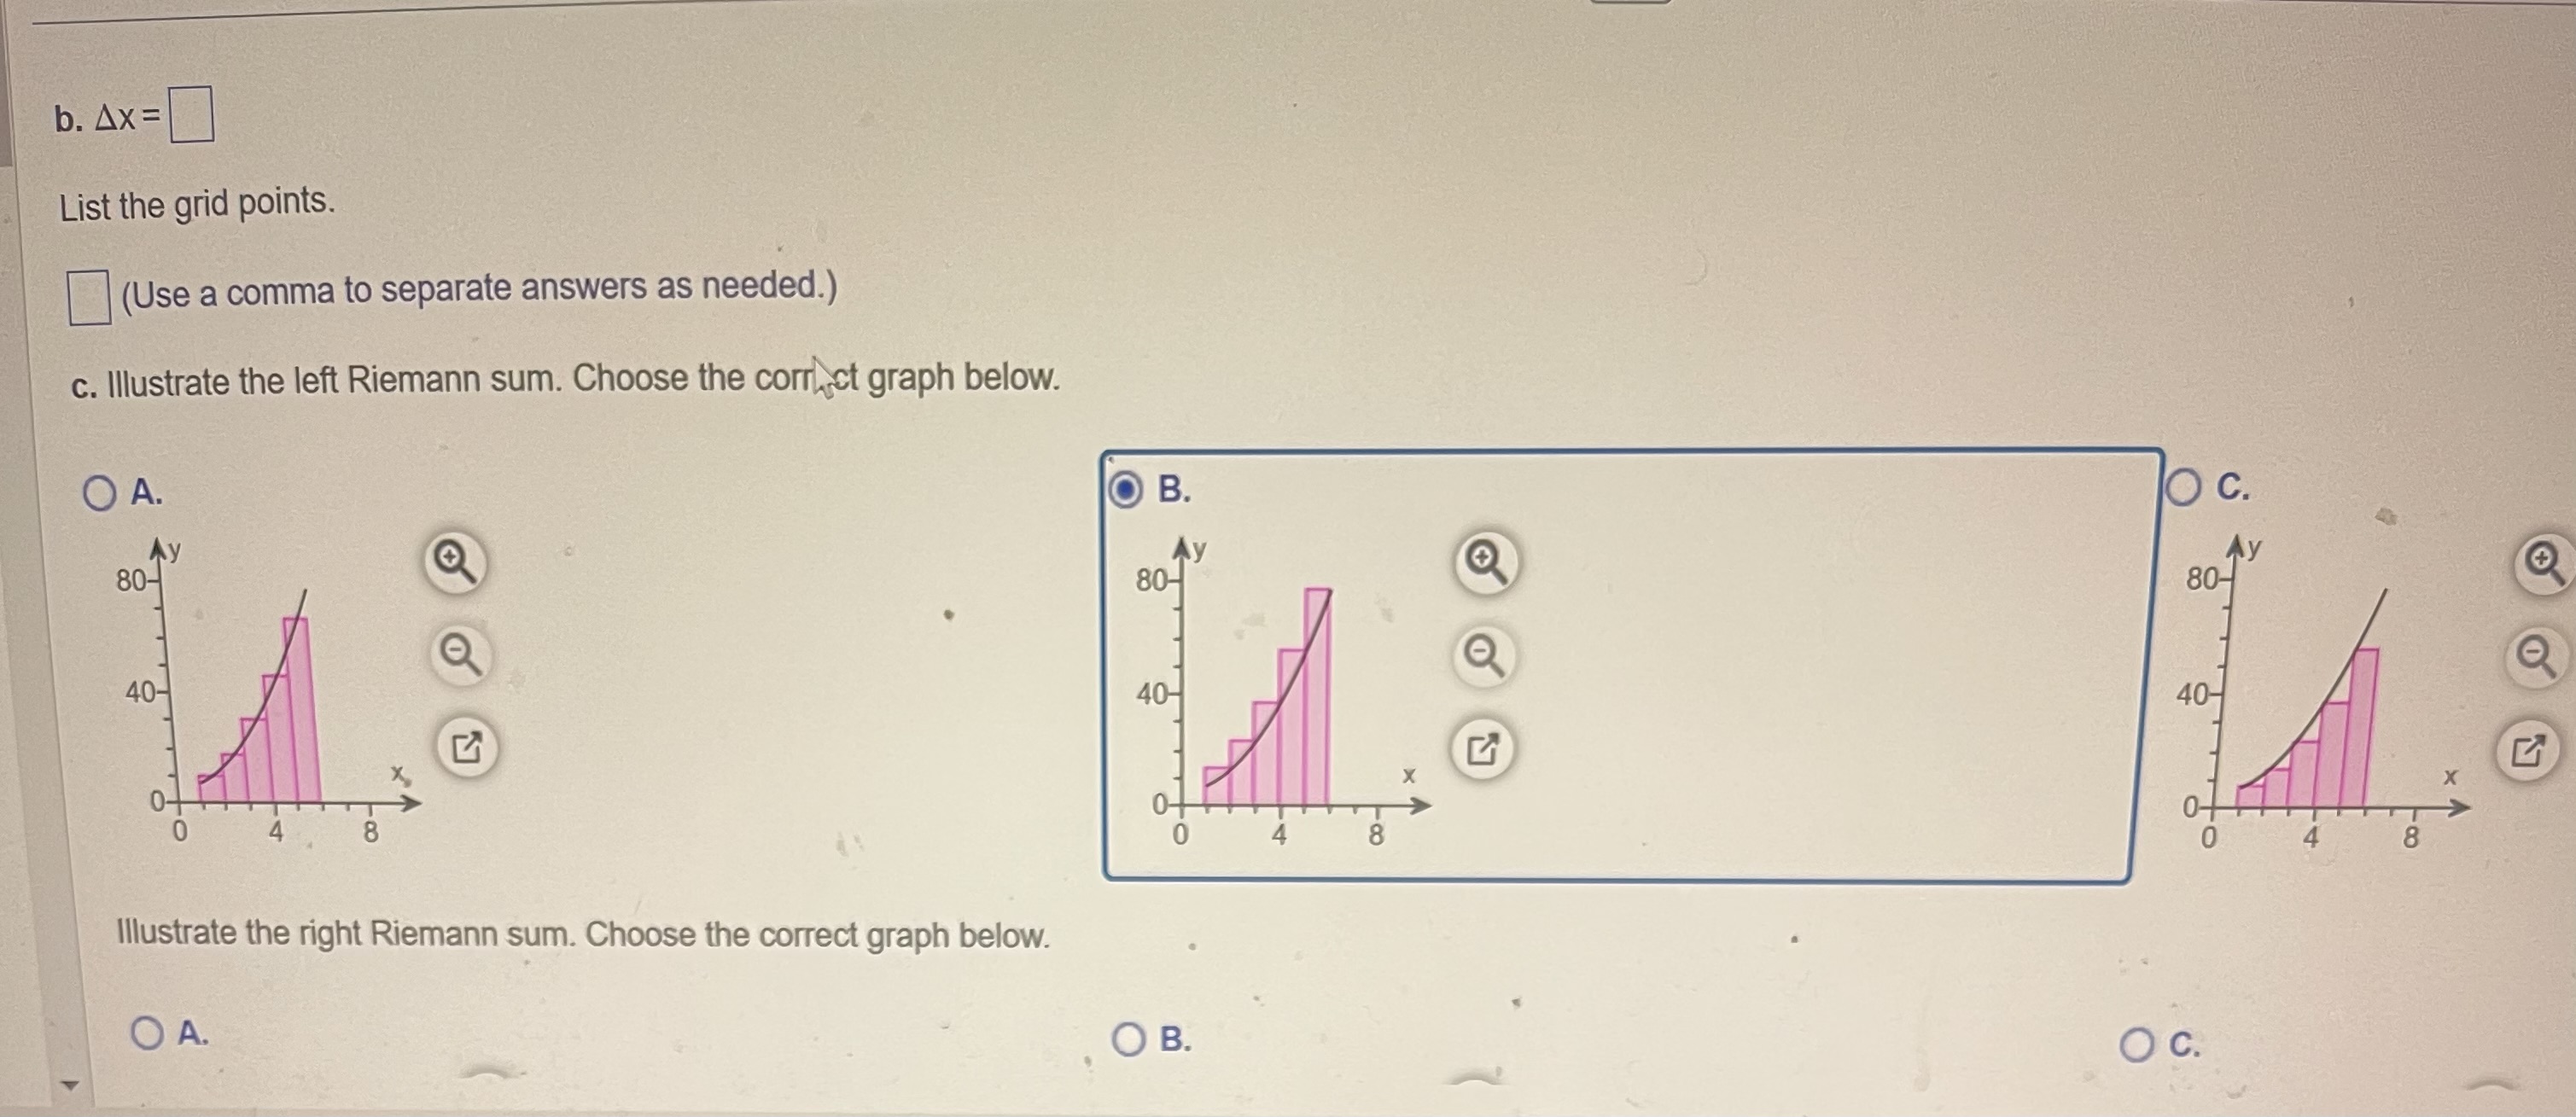
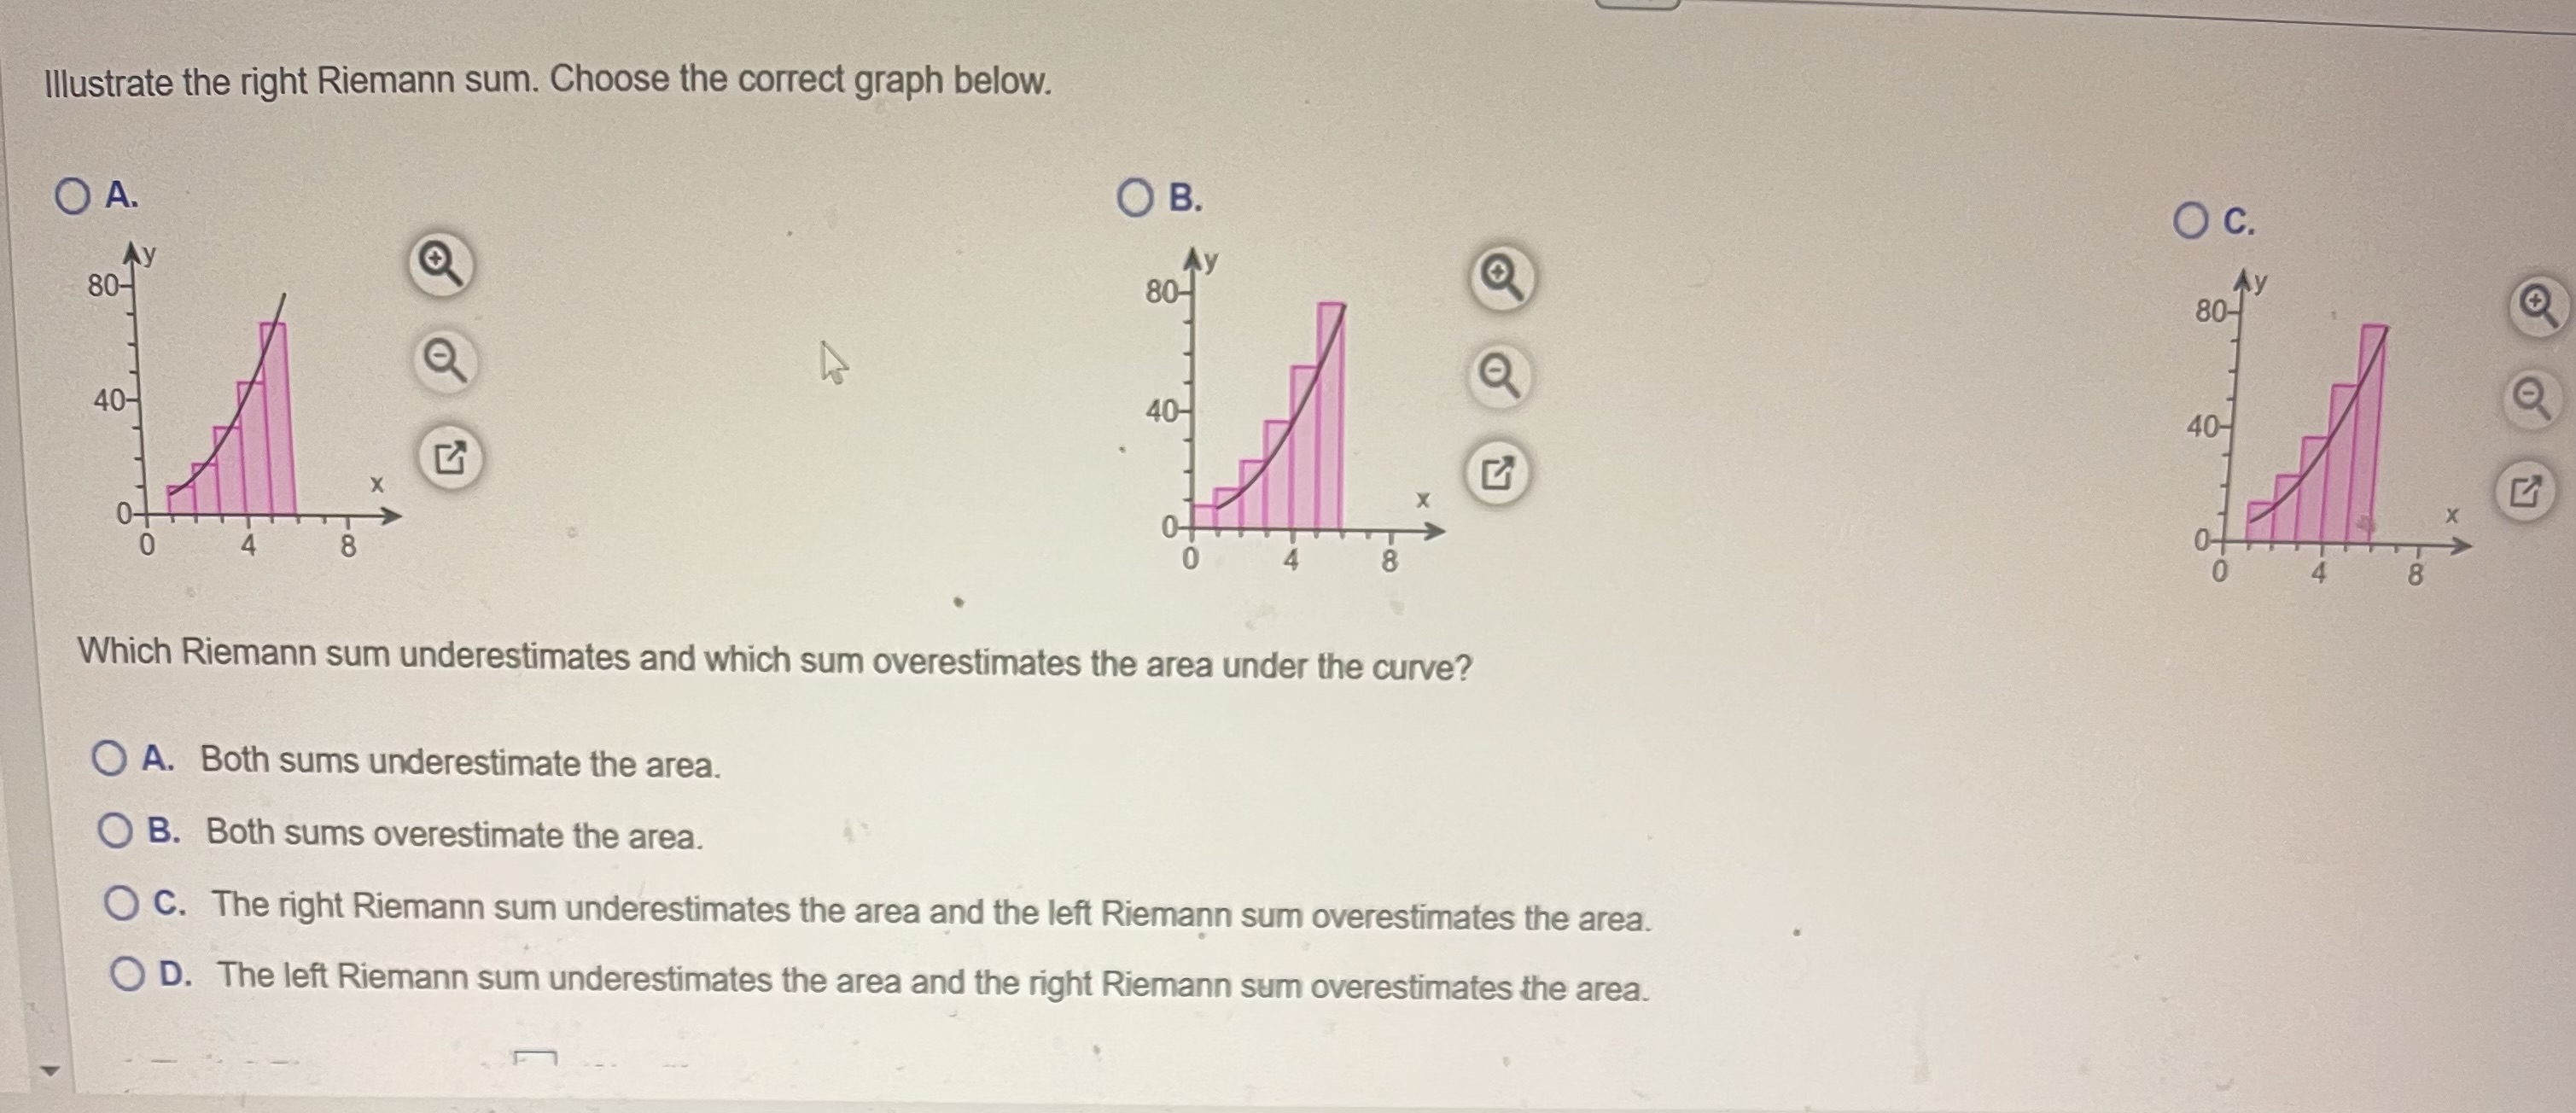
Complete the following steps for the given function, interval, and value of n. a. Sketch the graph of the function on the given interval. b. Calculate Ax and the grid points Xo, X1, ..., Xn. c. Illustrate the left and right Riemann sums, and determine which Riemann sum underestimates and which sum overestimates the area under the curve. d. Calculate the left and right Riemann sums. f(x) = 2x2 +5 on [1,6]; n=5 . . . Ay 80- 80 7 80- 40- 40- 40- X 0- 8 Which Riemann sum underestimates and which sum overestimates the area under the curve? O A. Both sums underestimate the area. O B. Both sums overestimate the area. O C. The right Riemann sum underestimates the area and the left Riemann sum overestimates the area. O D. The left Riemann sum underestimates the area and the right Riemann sum overestimates the area. d. The left Riemann sum is . (Simplify your answer.) The right Riemann sum is . (Simplify your answer.)b. AX = List the grid points. (Use a comma to separate answers as needed.) c. Illustrate the left Riemann sum. Choose the correct graph below. O A. O B. Ay 80- O c. 40- 40- 40- X X Illustrate the right Riemann sum. Choose the correct graph below. O A. O B. O C.Illustrate the right Riemann sum. Choose the correct graph below. O A. O B. 80-T O c. 40- 80-1 + X 40- X X Which Riemann sum underestimates and which sum overestimates the area under the curve? O A. Both sums underestimate the area. O B. Both sums overestimate the area. O C. The right Riemann sum underestimates the area and the left Riemann sum overestimates the area. O D. The left Riemann sum underestimates the area and the right Riemann sum overestimates the area.Complete the following steps for the given function, interval, and value of n. a. Sketch the graph of the function on the given interval. b. Calculate Ax and the grid points X, X1 , ..., Xn- c. Illustrate the left and right Riemann sums, and determine which Riemann sum underestimates and which sum overestimates the area under the curve. d. Calculate the left and right Riemann sums. f (x) = 2x2 +5 on [1,6]; n= 5 . . . a. Sketch the graph of f(x) = 2x2 + 5 on the interval [1, 6]. Choose the correct graph below. O A. O B. O C. OD. Ay 80- Ay 80- Ay 150- Ay 80- X X X 8 8 0 CO - 8 b. Ax = List the grid points. . (Use a comma to separate answers as needed.) c. Illustrate the left Riemann sum. Choose the correct graph below. O A. O B. O c
Step by Step Solution
There are 3 Steps involved in it

Get step-by-step solutions from verified subject matter experts