

Question: Complete the following table and draw a graph showing how the bond price for each bond changes over time as they move towards their maturity
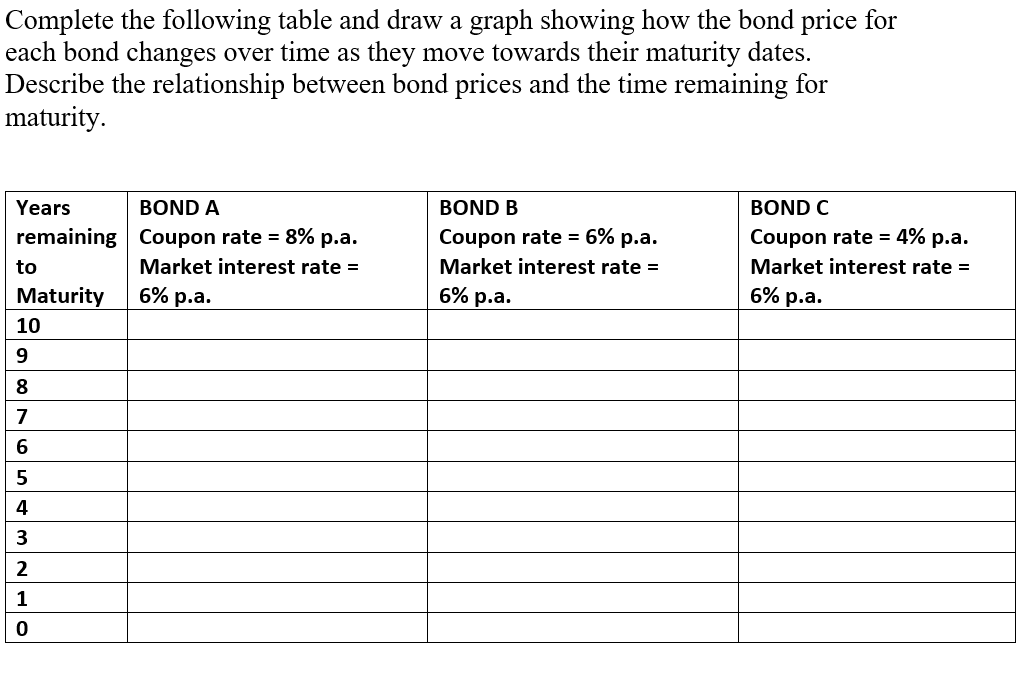
Complete the following table and draw a graph showing how the bond price for
each bond changes over time as they move towards their maturity dates.
Describe the relationship between bond prices and the time remaining for
maturity.
Step by Step Solution
There are 3 Steps involved in it
1 Expert Approved Answer
Step: 1 Unlock

Question Has Been Solved by an Expert!
Get step-by-step solutions from verified subject matter experts
Step: 2 Unlock
Step: 3 Unlock