

Question: Complete the following table and plot the total product (TP), average product (AP) and marginal product (MP) of labour and show the three stages
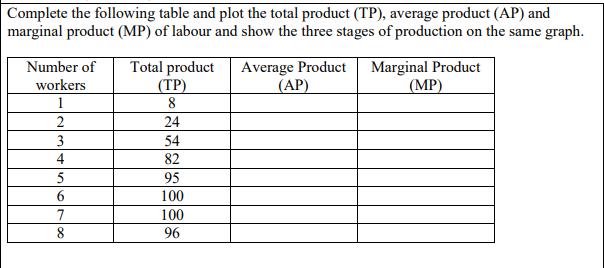
Complete the following table and plot the total product (TP), average product (AP) and marginal product (MP) of labour and show the three stages of production on the same graph. Number of workers 1 2 3 4 5 6 7 8 Total product (TP) 8 24 54 82 95 100 100 96 Average Product (AP) Marginal Product (MP)
Step by Step Solution
★★★★★
3.41 Rating (164 Votes )
There are 3 Steps involved in it
1 Expert Approved Answer
Step: 1 Unlock

Step 1 Answer The table Number of workers TP AP MP 1 8 8 8 2 24 12 16 3 54 18 30 4 82 205 28 5 95 19 ... View full answer
Question Has Been Solved by an Expert!
Get step-by-step solutions from verified subject matter experts
Step: 2 Unlock
Step: 3 Unlock