

Question: Complete the following table for the requested ratios. 2015 $'000 1,600 4,000 5,600 240 3,800 2016 $'000 1,800 4,500 6,300 290 2014 $'000 1,500 3,500
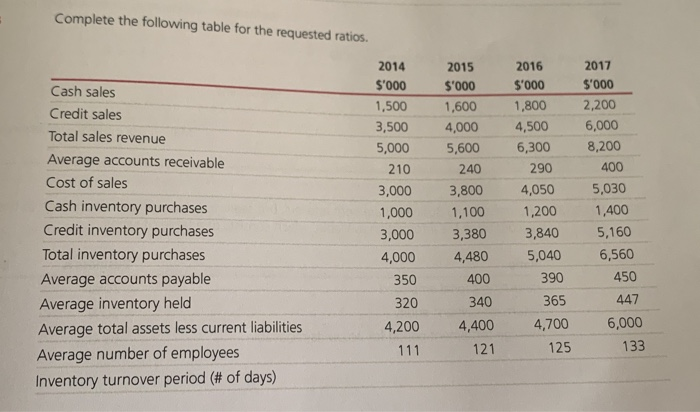

Complete the following table for the requested ratios. 2015 $'000 1,600 4,000 5,600 240 3,800 2016 $'000 1,800 4,500 6,300 290 2014 $'000 1,500 3,500 5,000 210 3,000 1,000 3,000 4,000 350 320 4,200 111 Cash sales Credit sales Total sales revenue Average accounts receivable Cost of sales Cash inventory purchases Credit inventory purchases Total inventory purchases Average accounts payable Average inventory held Average total assets less current liabilities Average number of employees Inventory turnover period (# of days) 2017 $'000 2,200 6,000 8,200 400 5,030 1,400 5,160 6,560 1,100 4,050 1,200 3,840 5,040 390 450 3,380 4,480 400 340 4,400 121 365 4,700 125 447 6,000 133 Debtors average settlement (# of days) Creditors average settlement (# of days) Sales revenue to capital employed (times) Sales revenue per employee allowing results
Step by Step Solution
There are 3 Steps involved in it

Get step-by-step solutions from verified subject matter experts