

Question: Complete the following table: Ratio Current ratio Quick ratio total assets turn over Average collection period Inventory turnover Average inventory age Average payment ratio
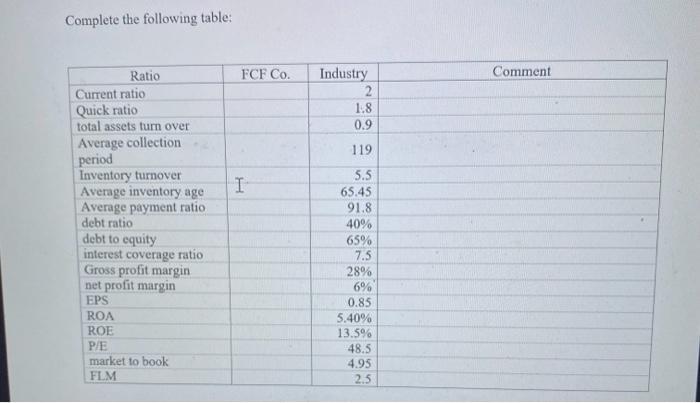
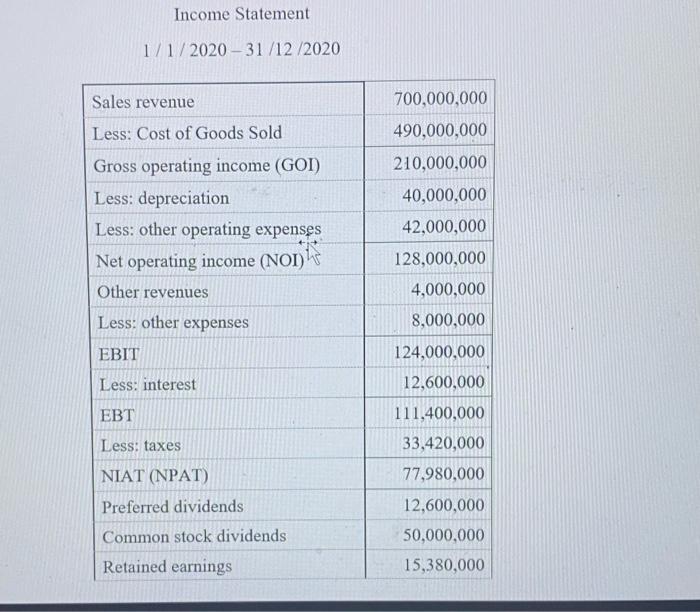
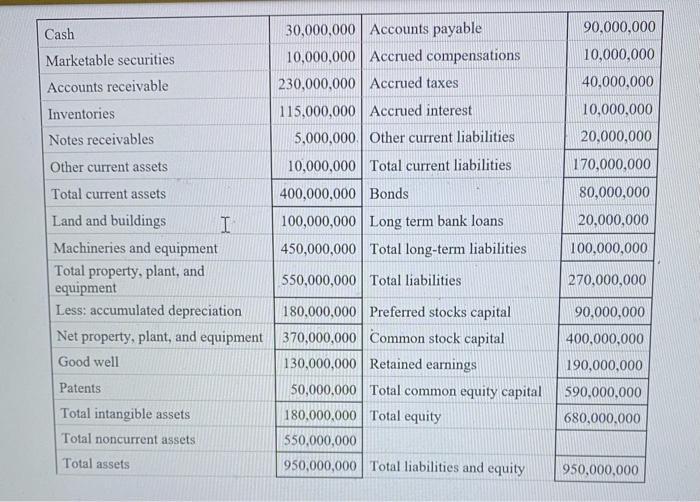
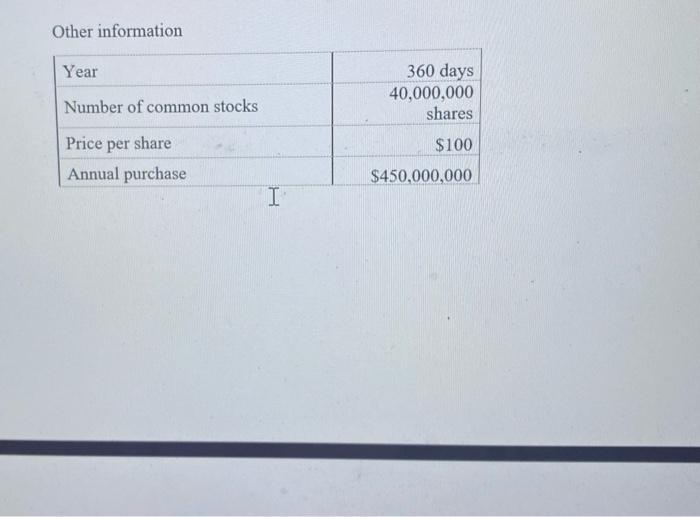
Complete the following table: Ratio Current ratio Quick ratio total assets turn over Average collection period Inventory turnover Average inventory age Average payment ratio debt ratio debt to equity interest coverage ratio Gross profit margin net profit margin EPS ROA ROE P/E market to book FLM FCF Co. I Industry 2 1.8 0.9 119 5.5 65.45 91.8 40% 65% 7.5 28% 6% 0.85 5.40% 13.5% 48.5 4.95 2.5 Comment Income Statement 1/1/2020-31/12/2020 Sales revenue Less: Cost of Goods Sold Gross operating income (GOI) Less: depreciation Less: other operating expenses Net operating income (NOI) Other revenues Less: other expenses EBIT Less: interest EBT Less: taxes NIAT (NPAT) Preferred dividends Common stock dividends Retained earnings 700,000,000 490,000,000 210,000,000 40,000,000 42,000,000 128,000,000 4,000,000 8,000,000 124,000,000 12,600,000 111,400,000 33,420,000 77,980,000 12,600,000 50,000,000 15,380,000 Cash. Marketable securities Accounts receivable Inventories Notes receivables Other current assets Total current assets Land and buildings I Machineries and equipment Total property, plant, and equipment Less: accumulated depreciation Net property, plant, and equipment Good well Patents Total intangible assets Total noncurrent assets Total assets 30,000,000 Accounts payable 10,000,000 Accrued compensations 230,000,000 Accrued taxes 115,000,000 Accrued interest 5,000,000. Other current liabilities. 10,000,000 Total current liabilities 400,000,000 Bonds 100,000,000 Long term bank loans 450,000,000 Total long-term liabilities 550,000,000 Total liabilities 180,000,000 Preferred stocks capital 370,000,000 Common stock capital 130,000,000 Retained earnings 50,000,000 Total common equity capital 180,000,000 Total equity 550,000,000 950,000,000 Total liabilities and equity 90,000,000 10,000,000 40,000,000 10,000,000 20,000,000 170,000,000 80,000,000 20,000,000 100,000,000 270,000,000 90,000,000 400,000,000 190,000,000 590,000,000 680,000,000 950,000,000 Other information Year Number of common stocks Price per share Annual purchase I 360 days 40,000,000 shares $100 $450,000,000
Step by Step Solution
3.27 Rating (153 Votes )
There are 3 Steps involved in it
Answer Lets complete the table using the provided financial ratios and income statement data Ratio FCF Co Industry Comment Current ratio 2 Quick ratio ... View full answer

Get step-by-step solutions from verified subject matter experts