

Question: Complete the market data analysis in Table 1 and Analyze Tables 2-5 for Module 5: Rely on the census data as provided, rather than attempt
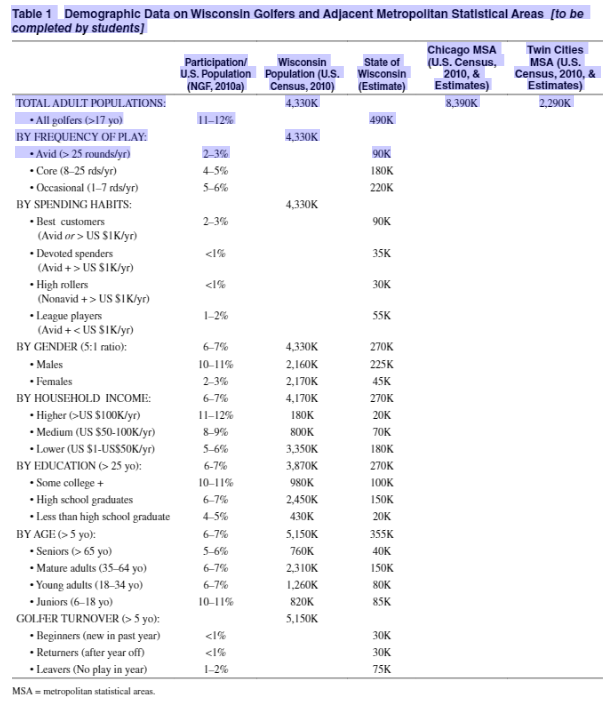
Complete the market data analysis in Table 1 and Analyze Tables 2-5 for Module 5: Rely on the census data as provided, rather than attempt to update the data.) Based on completion of the demographic analyses, which trail option or options should WAG initiate and how many added golf tourists and travel days reasonably could be expected for each? And what you believe to be the best Segmentation and Trail Option strategy for Blazing Trails by the Wisconsin Alliance for Golf (WAG). Provide detailed justification based on your market data analysis. NOTE: Rely on the census data provided in Table 1 and the announced update, rather than seek to update this demographic data on your own. Your analysis starts with completing the two columns of estimates for the Chicago and Twin Cities MSAs. For example, for the first row, you enter an estimate of 11-12% of the Chicago MSA (8,390K), or an estimated 950K adult golfers; same 11-12% of the TC MSA (2,290K), or an estimated 250K. So, you can compare estimated Adult (>17yo) Golfers in WI at 490K, to Chi at 950K, to TC at 250K. And so on down the rows for the 'Population,' 'Frequency,' and 'Spending' categories... Then use the demographic numbers provided (in he announcement below) to complete the last four categories ('Income,' 'Education,' 'Age,' and 'Turnover') and compute estimates for the Chicago and TC MSA's. Please use this note to amend the last four categories in Table 1. These are rough estimates for the Chicago MSA and TC MSA of populations for the last 4 categories. (In the original case we had a note providing rough estimates for these four categories.) These rough estimates are based on the WI percentages of Total Adult Population: HOUSEHOLDS (with income): Chicago: 8,000; TC: 2,200 EDUCATION (>25yo): Chicago: 7,500; TC: 2,000 AGE (>5yo): Chicago: 10,000, TC: 2,700 TURNOVER (>5yo): Chicago: 10,000; TC: 2,700 Please base your analysis on these rough estimates, rather than obtaining your own data.
Step by Step Solution
There are 3 Steps involved in it

Get step-by-step solutions from verified subject matter experts