

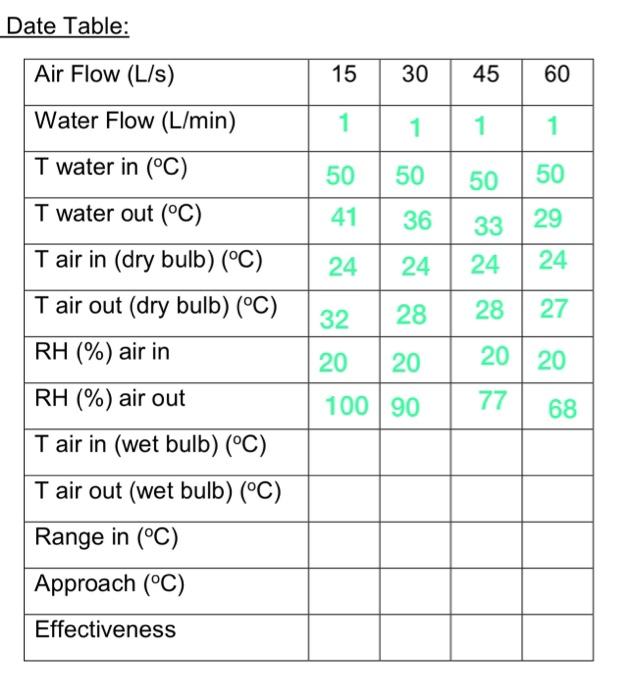
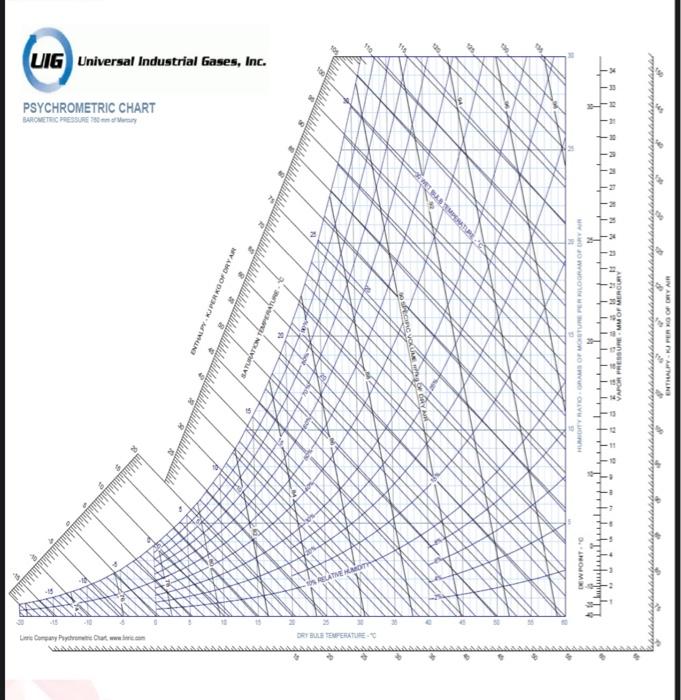
Question: complete the missing data in the schedual by taking the readings from the chart. this might help this is all details need to be answerd
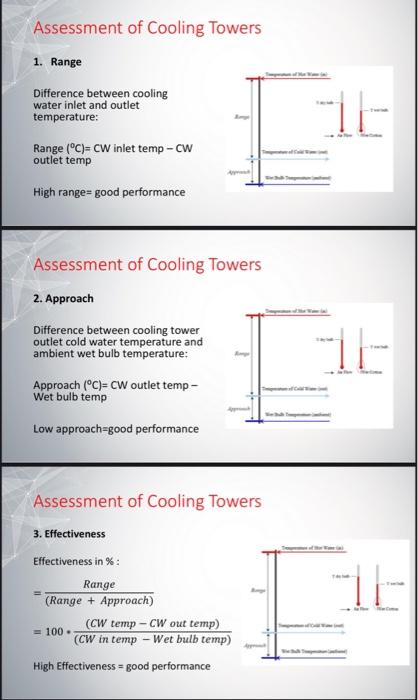
[ Assessment of Cooling Towers 1. Range Difference between cooling water inlet and outlet temperature: Range (C)=CW inlet temp CW outlet temp High range = good performance Assessment of Cooling Towers 2. Approach Difference between cooling tower outlet cold water temperature and ambient wet bulb temperature: Approach (C)=CW outlet tempWet bulb temp Low approach=good performance Assessment of Cooling Towers 3. Effectiveness Effectiveness in \%: =(Range+Approach)Range=100(CWintempWetbulbtemp)(CWtempCWouttemp) High Effectiveness = good performance [ Assessment of Cooling Towers 1. Range Difference between cooling water inlet and outlet temperature: Range (C)=CW inlet temp CW outlet temp High range = good performance Assessment of Cooling Towers 2. Approach Difference between cooling tower outlet cold water temperature and ambient wet bulb temperature: Approach (C)=CW outlet tempWet bulb temp Low approach=good performance Assessment of Cooling Towers 3. Effectiveness Effectiveness in \%: =(Range+Approach)Range=100(CWintempWetbulbtemp)(CWtempCWouttemp) High Effectiveness = good performance
Step by Step Solution
There are 3 Steps involved in it

Get step-by-step solutions from verified subject matter experts