

Question: Complete the question 1 and the table above using this data Will thumbs up right away, thank you! 0.13 0.2 Input EBIT as a percent
Complete the question 1 and the table above using this data
Will thumbs up right away, thank you!
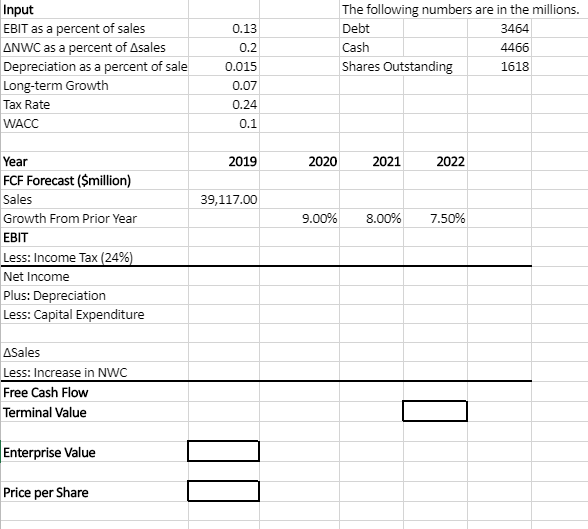
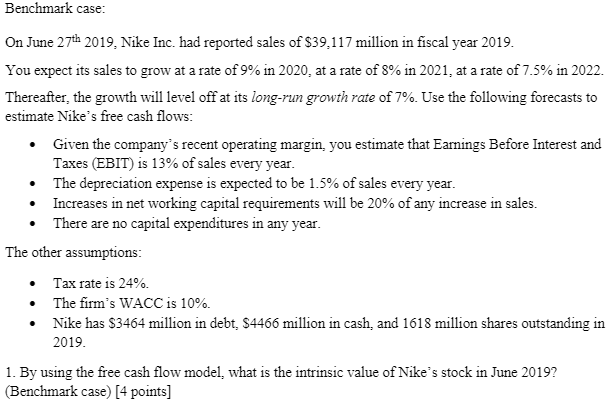
0.13 0.2 Input EBIT as a percent of sales ANWC as a percent of Asales Depreciation as a percent of sale Long-term Growth Tax Rate WACC The following numbers are in the millions. Debt 3464 4466 Shares Outstanding 1618 Cash 0.015 0.07 0.24 0.1 2019 2020 2021 2022 39,117.00 9.00% 8.00% 7.50% Year FCF Forecast ($million) Sales Growth From Prior Year EBIT Less: Income Tax (24%) Net Income Plus: Depreciation Less: Capital Expenditure ASales Less: Increase in NWC Free Cash Flow Terminal Value Enterprise Value Price per Share Benchmark case: On June 27th 2019, Nike Inc. had reported sales of $39,117 million in fiscal year 2019. You expect its sales to grow at a rate of 9% in 2020, at a rate of 8% in 2021, at a rate of 7.5% in 2022. Thereafter, the growth will level off at its long-run growth rate of 7%. Use the following forecasts to estimate Nike's free cash flows: . Given the company's recent operating margin, you estimate that Earnings Before Interest and Taxes (EBIT) is 13% of sales every year. The depreciation expense is expected to be 1.5% of sales every year. Increases in net working capital requirements will be 20% of any increase in sales. There are no capital expenditures in any year. The other assumptions: Tax rate is 24% The firm's WACC is 10%. Nike has $3464 million in debt, $4466 million in cash, and 1618 million shares outstanding in 2019. 1. By using the free cash flow model, what is the intrinsic value of Nike's stock in June 2019? (Benchmark case) [4 points]
Step by Step Solution
There are 3 Steps involved in it

Get step-by-step solutions from verified subject matter experts