

Question: Below is the Income Statement and Balance sheet for the Berry Company. Sales Cost of goods sold Operating Expenses Marketing expenses R&D expenses Administrative
![(a) Return on Equity \[ =\] (b) Return on Sales (c) Asset Turnover (d) Asset-to Equity Ratio \[ =\] (e) Accounts Receivable](https://dsd5zvtm8ll6.cloudfront.net/si.experts.images/questions/2022/11/6374bb9b66ea2_1668594586934.jpg)
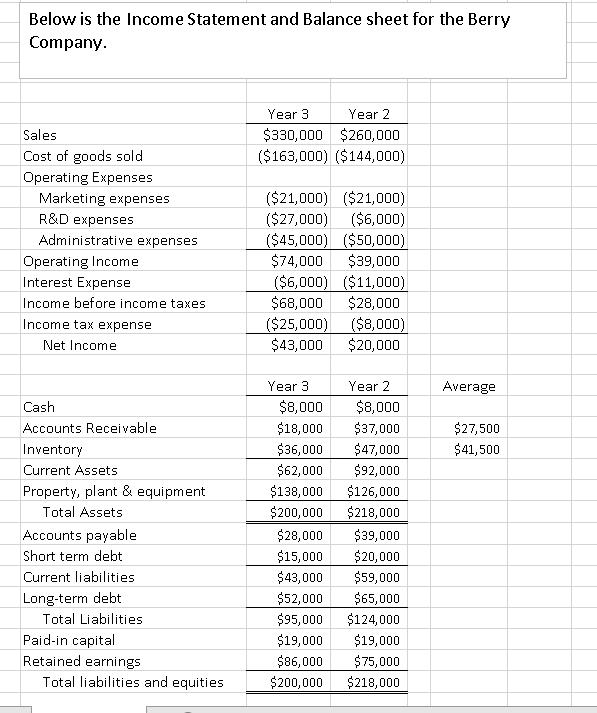
Below is the Income Statement and Balance sheet for the Berry Company. Sales Cost of goods sold Operating Expenses Marketing expenses R&D expenses Administrative expenses Operating Income Interest Expense Income before income taxes Income tax expense Net Income Cash Accounts Receivable Inventory Current Assets Property, plant & equipment Total Assets Accounts payable Short term debt Current liabilities Long-term debt Total Liabilities Paid-in capital Retained earnings Total liabilities and equities Year 3 Year 2 $330,000 $260,000 ($163,000) ($144,000) ($21,000) ($21,000) ($27,000) ($6,000) ($45,000) ($50,000) $74,000 $39,000 ($6,000) ($11,000) $68,000 $28,000 ($25,000) ($8,000) $43,000 $20,000 Year 3 Year 2 $8,000 $8,000 $18,000 $37,000 $36,000 $47,000 $62,000 $92,000 $138,000 $126,000 $200,000 $218,000 $28,000 $39,000 $15,000 $20,000 $43,000 $59,000 $52,000 $65,000 $95,000 $124,000 $19,000 $19,000 $75,000 $218,000 $86,000 $200,000 Average $27,500 $41,500 (a) (b) (c) (d) (e) (g) (h) (0) (0) Return on Equity Return on Sales Asset Turnover Asset-to Equity Ratio Accounts Receivable turnover Inventory turnover Number of days' sales in inventory Debt ratio Debt-to-equity ratio Current ratio II. || 11 II || || ||
Step by Step Solution
3.43 Rating (140 Votes )
There are 3 Steps involved in it
ADS 18 Dutput characteristic of a CE Configuration are curves plotted between VCE and Ic for constan... View full answer

Get step-by-step solutions from verified subject matter experts