

Question: Complete the sensitivity tables in Table 2, assuming initially that the project has average risk. Also, develop new tables which show sensitivity of NPV and
- Complete the sensitivity tables in Table 2, assuming initially that the project has average risk. Also, develop new tables which show sensitivity of NPV and the other variables to the initial variable cost and the cost of capital. Assume that each of these variables can deviate from its base case, or expected value, by plus or minus 10 percent, 20 percent, and 30 percent.
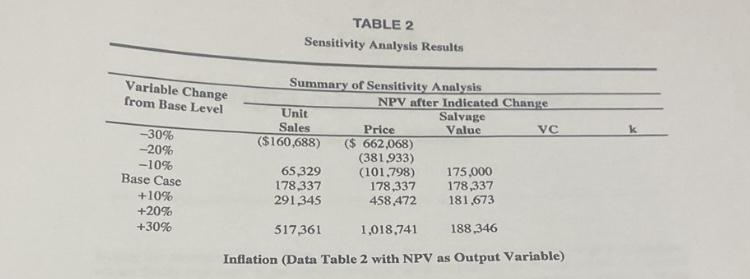
Variable Change from Base Level TABLE 2 Sensitivity Analysis Results Summary of Sensitivity Analysis NPV after Indicated Change Unit Sales Price Salvage Value -30% ($160,688) ($ 662,068) -20% (381,933) -10% 65,329 (101,798) 175,000 Base Case 178,337 178,337 178,337 +10% 291,345 458,472 181,673 +20% +30% 517,361 1,018,741 188,346 VC k Inflation (Data Table 2 with NPV as Output Variable)
Step by Step Solution
There are 3 Steps involved in it
1 Expert Approved Answer
Step: 1 Unlock

Question Has Been Solved by an Expert!
Get step-by-step solutions from verified subject matter experts
Step: 2 Unlock
Step: 3 Unlock