

Question: Complete the table below by computing the expected number of deaths in the standard population for each age group for both populations. Calculate the age
Complete the table below by computing the expected number of deaths in the standard population for each age group for both populations. Calculate the age adjusted rates for the two populations.Please help I am struggling to understand
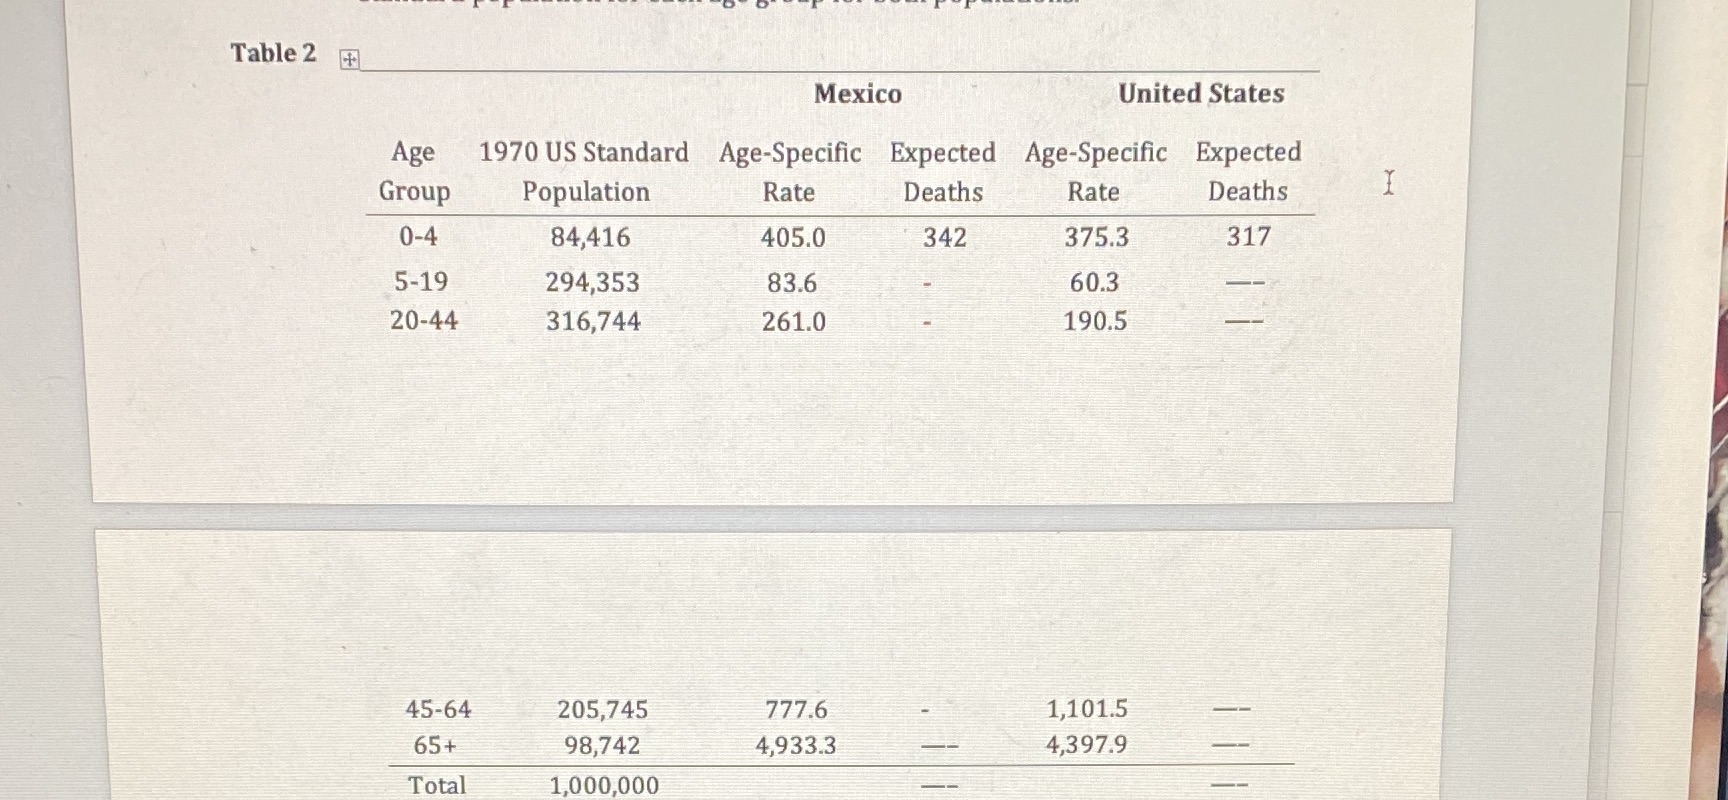
Table 2 Mexico United States Age 1970 US Standard Age-Specific Expected Age-Specific Expected Group Population Rate Deaths Rate Deaths 0-4 84,416 405.0 342 375.3 317 5-19 294,353 83.6 60.3 20-44 316,744 261.0 190.5 45-64 205,745 777.6 1,101.5 65+ 98,742 4,933.3 4,397.9 Total 1,000,000
Step by Step Solution
There are 3 Steps involved in it
1 Expert Approved Answer
Step: 1 Unlock

Question Has Been Solved by an Expert!
Get step-by-step solutions from verified subject matter experts
Step: 2 Unlock
Step: 3 Unlock