

Question: Complete the table below. Data Table 6.1. Data and results of computations Height y, Falling time t, s Average of falling time t, Square of
Complete the table below.
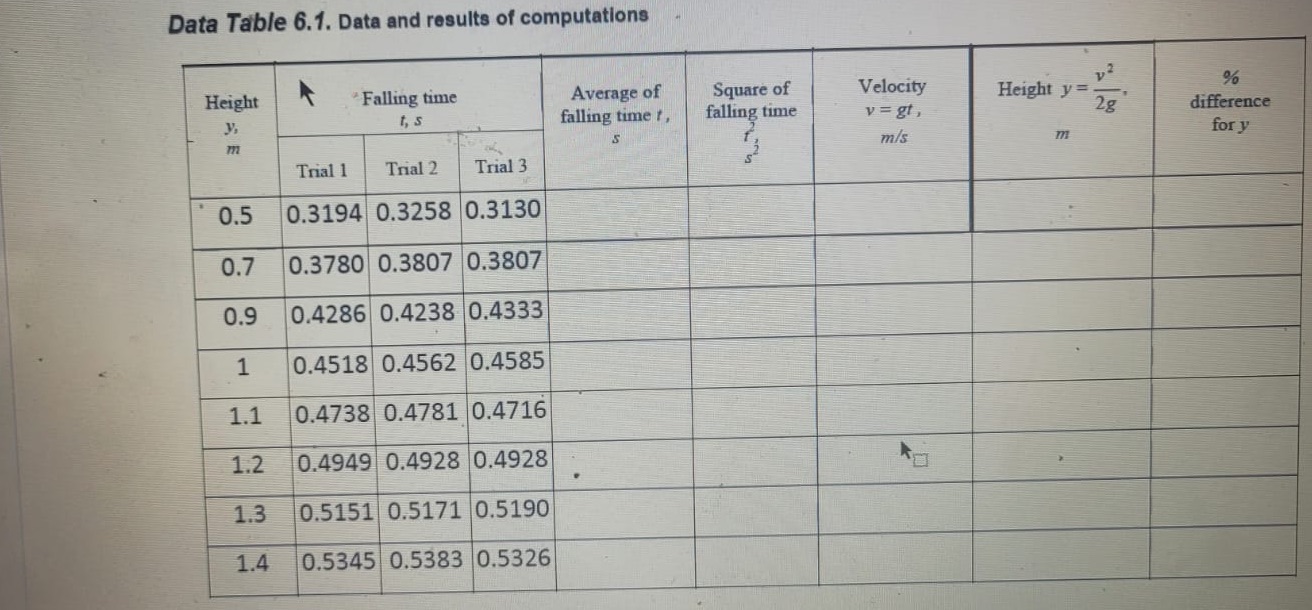
Data Table 6.1. Data and results of computations Height y, "Falling time t, s Average of falling time t, Square of falling time 12 Velocity Height y=. v = gt, 2g 772 m/s % difference for y m Trial 1 Trial 2 Trial 3 0.5 0.3194 0.3258 0.3130 0.7 0.3780 0.3807 0.3807 0.9 91 0.4286 0.4238 0.4333 0.4518 0.4562 0.4585 1.1 0.4738 0.4781 0.4716 1.2 0.4949 0.4928 0.4928 1.3 0.5151 0.5171 0.5190 1.4 0.5345 0.5383 0.5326
Step by Step Solution
There are 3 Steps involved in it
1 Expert Approved Answer
Step: 1 Unlock

Question Has Been Solved by an Expert!
Get step-by-step solutions from verified subject matter experts
Step: 2 Unlock
Step: 3 Unlock