

Question: Complete the table by calculating the surplus or deficit both in dollar terms and as a percentage of GDP. If necessary, round your answers to
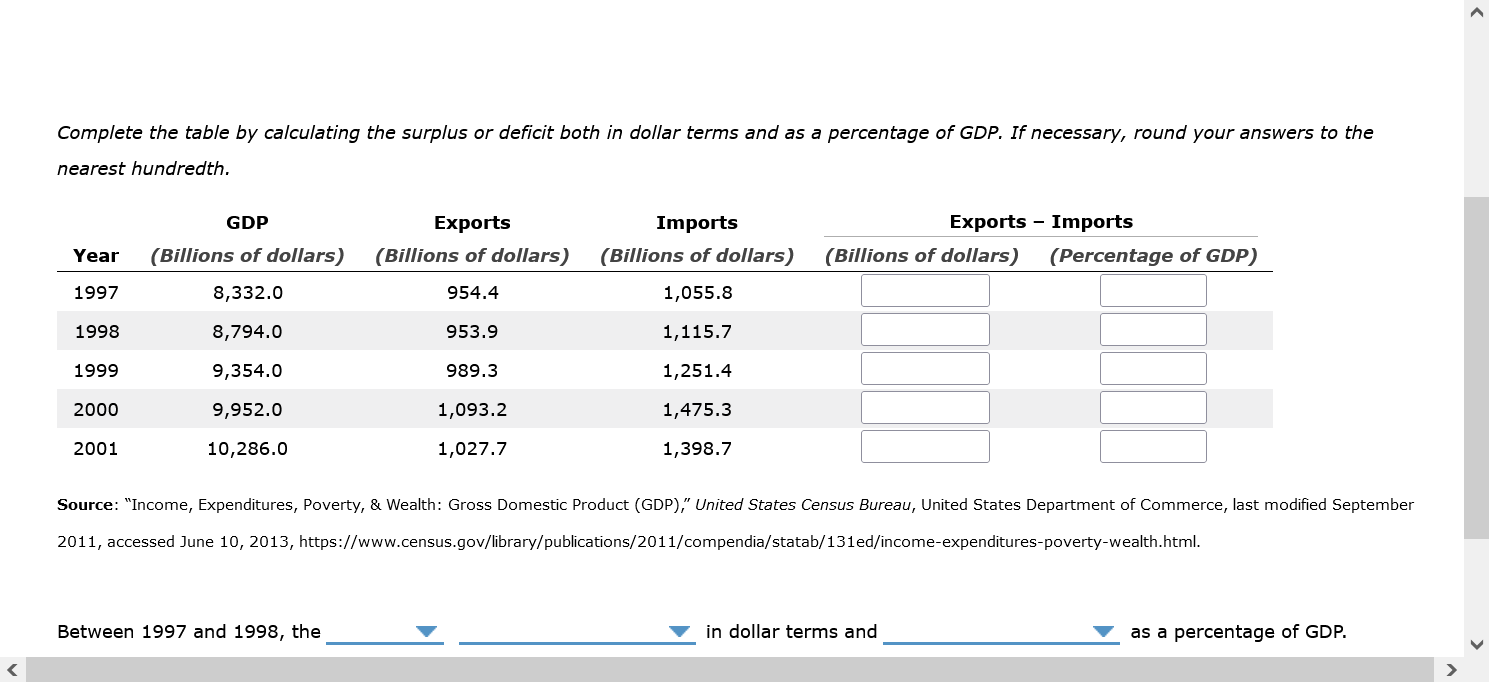
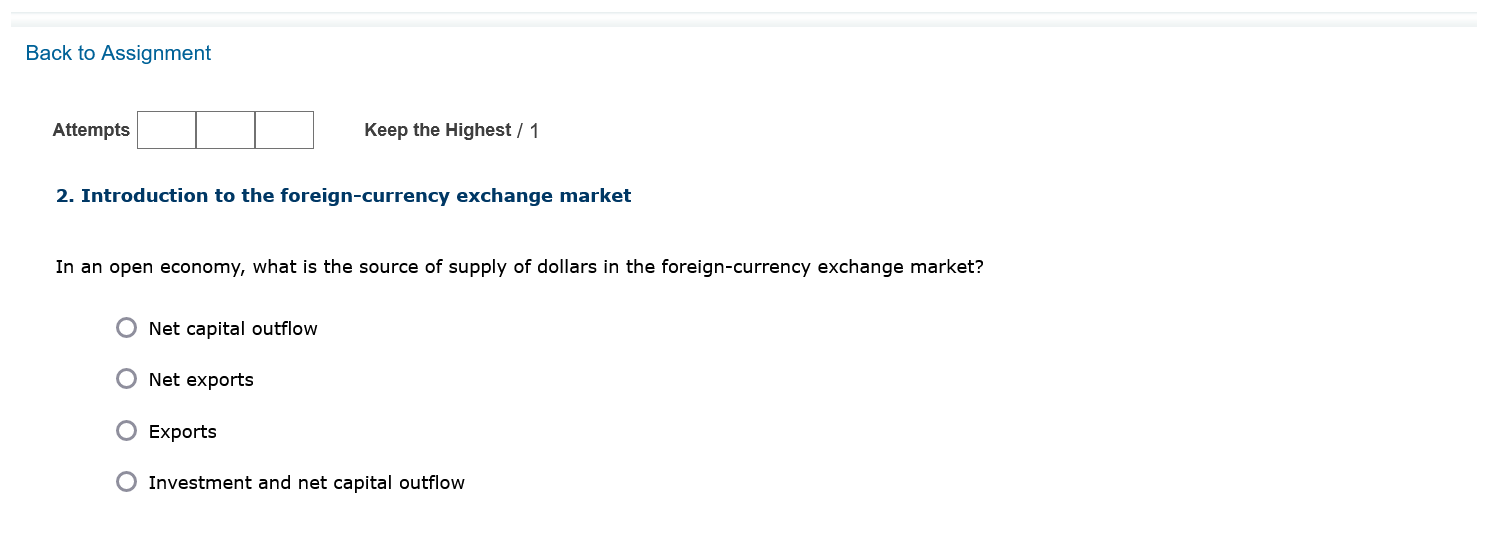
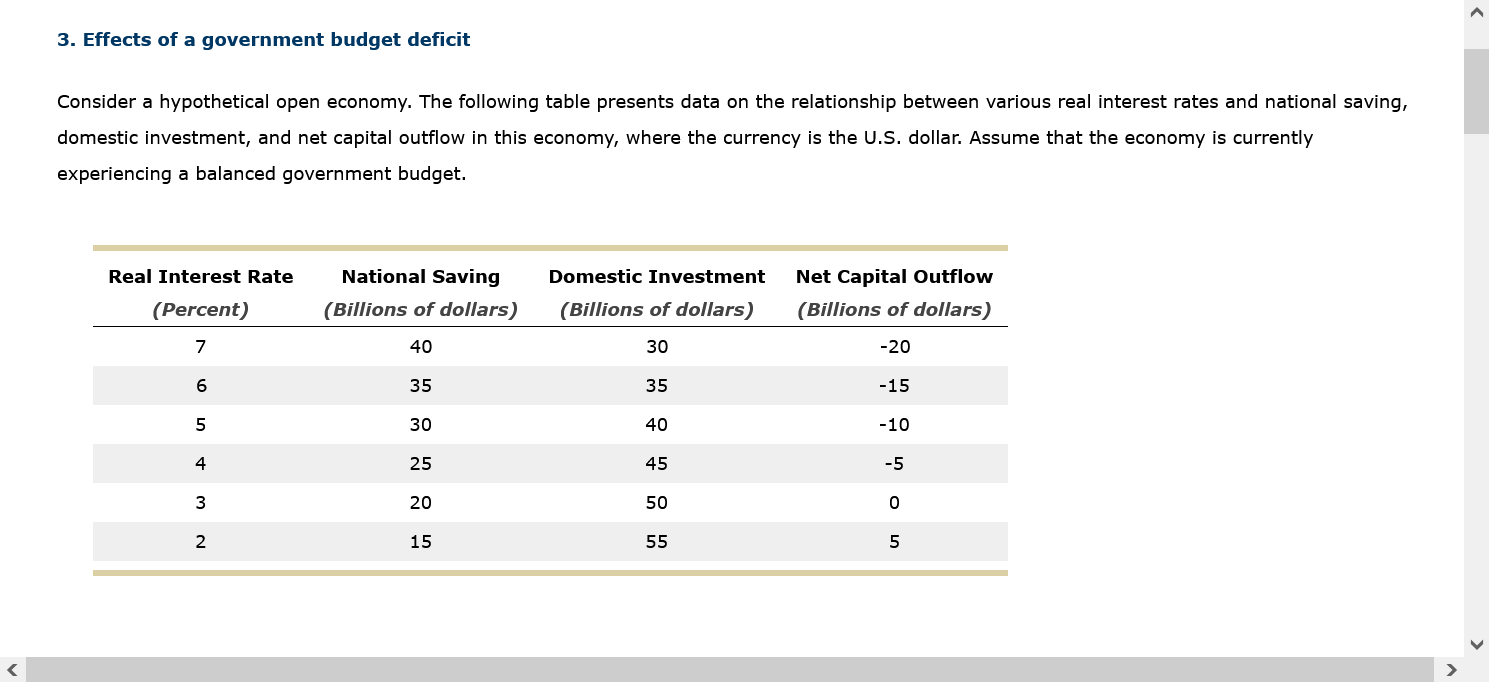

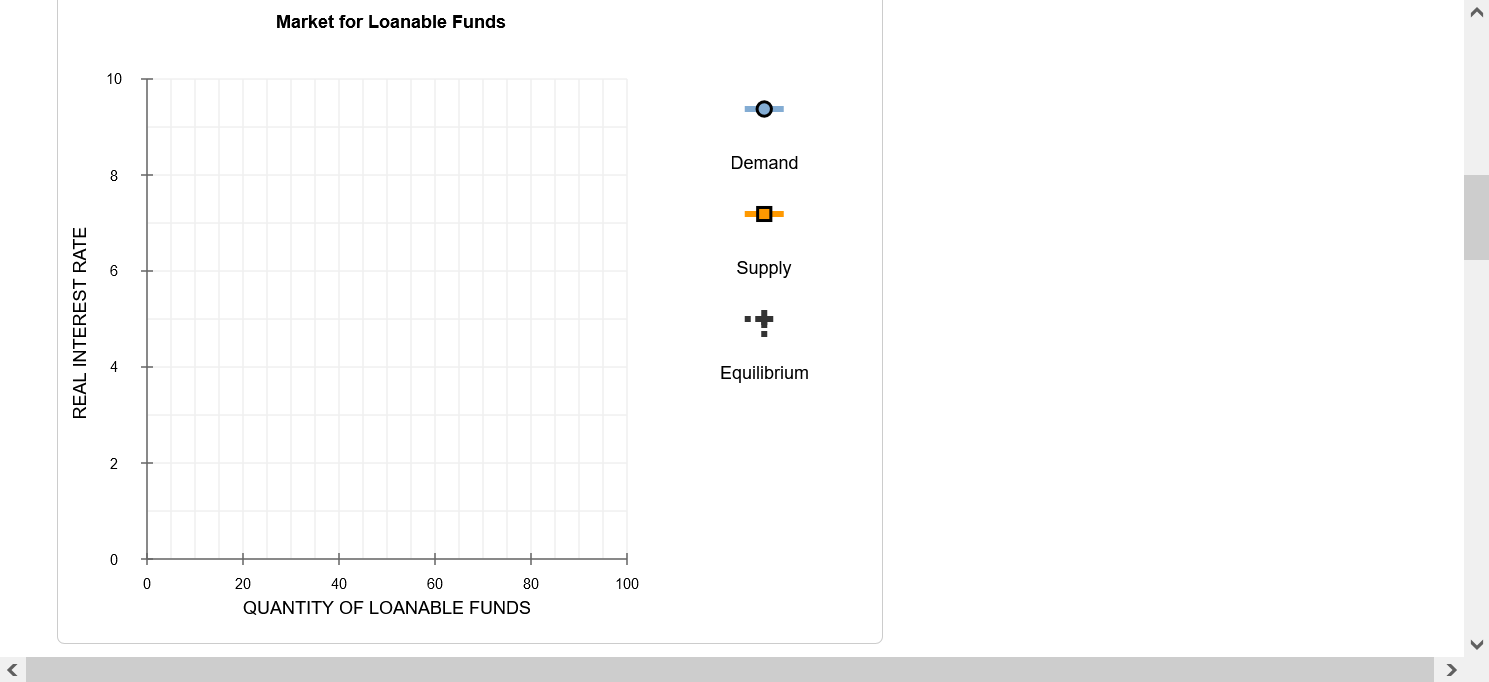

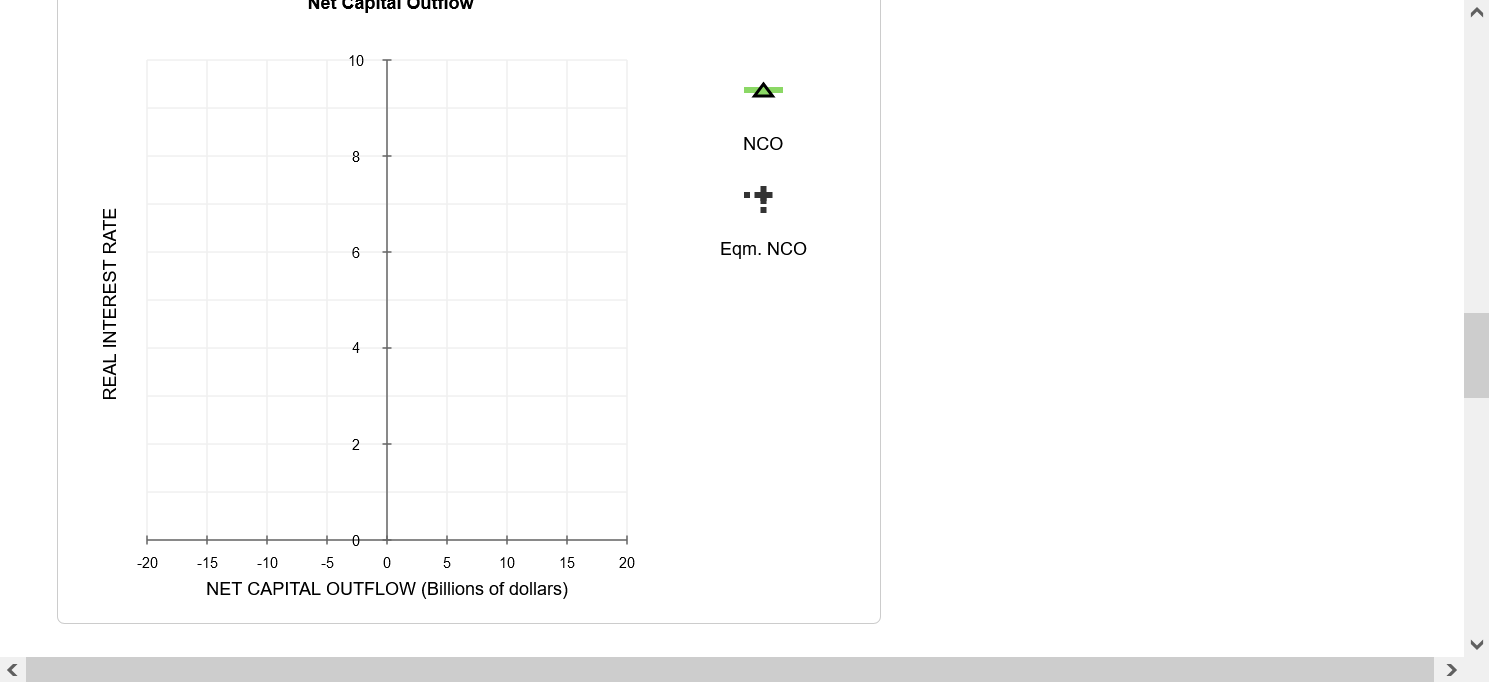
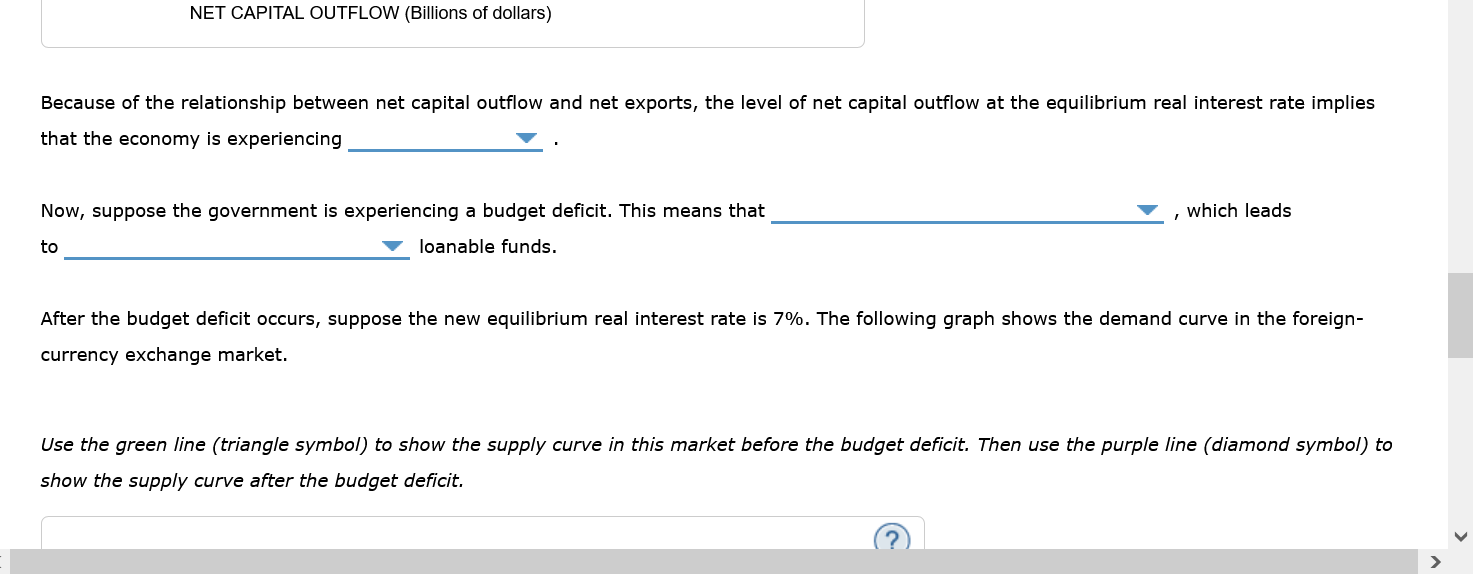

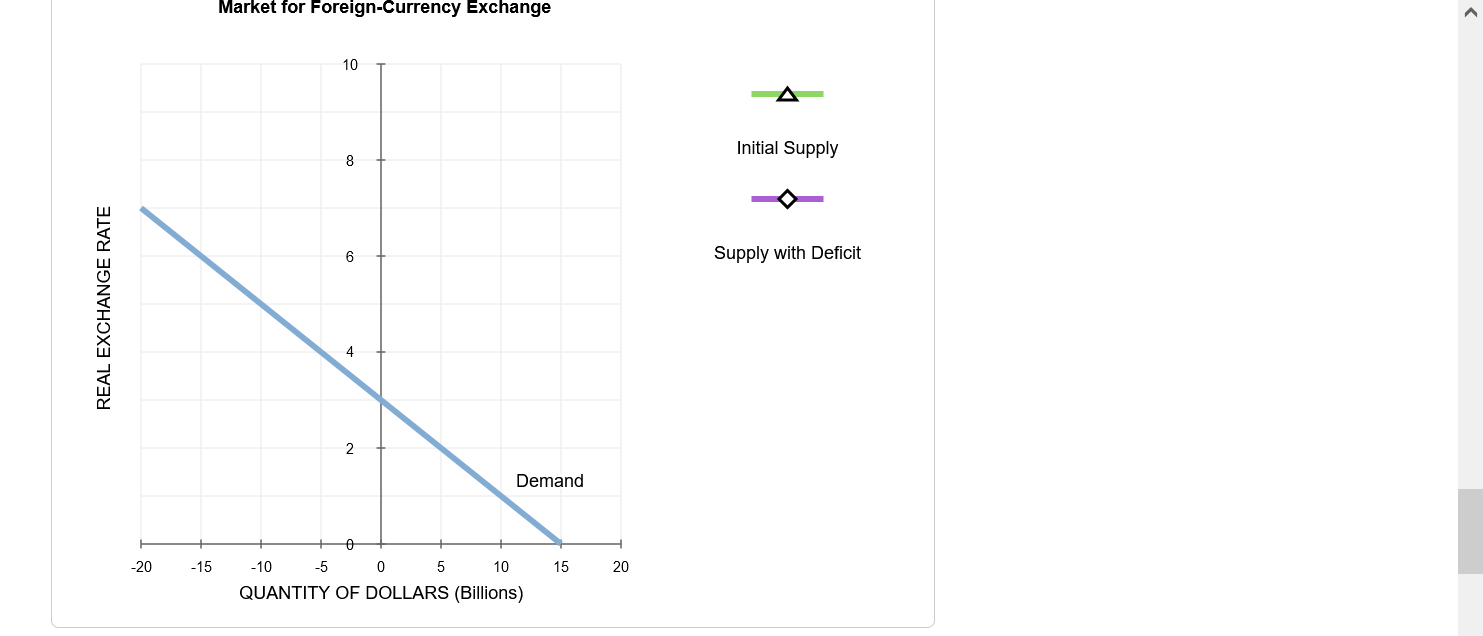
Complete the table by calculating the surplus or deficit both in dollar terms and as a percentage of GDP. If necessary, round your answers to the nearest hundredth. GDP Exports Imports Exports - Imports Year (Billions of dollars) (Billions of dollars) (Billions of dollars) (Billions of dollars) (Percentage of GDP) 1997 8,332.0 954.4 1,055.8 1998 8,794.0 953.9 1,115.7 1999 9,354.0 989.3 1,251.4 2000 9,952.0 1,093.2 1,475.3 2001 10,286.0 1,027.7 1,398.7 Source: "Income, Expenditures, Poverty, & Wealth: Gross Domestic Product (GDP)," United States Census Bureau, United States Department of Commerce, last modified September 2011, accessed June 10, 2013, https://www.census.gov/library/publications/2011/compendia/statab/131ed/income-expenditures-poverty-wealth.html. Between 1997 and 1998, the in dollar terms and as a percentage of GDP.Back to Assignment Attempts l I Keep the Highest I 1 2. Introduction to the foreign-currency exchange market In an open economy, what is the source of supply of dollars in the foreign-currency exchange market? 0 Net capital outflow 0 Net exports 0 Exports 0 Investment and net capital outow 3. Effects of a government budget decit Consider a hypothetical open economy. The following table presents data on the relationship between various real interest rates and national saving, domestic investment, and net capital outow in this economy, where the currency is the U.S. dollar. Assume that the economy is currently experiencing a balanced government budget. Real Interest Rate National Saving Domestic Investment Net Capital Outow (Percent) (Billions of dollars) (Billions of dollars) (Billions of dollars) 7 40 30 -20 6 35 35 -15 5 30 40 -1O 4 25 45 -5 3 20 50 0 2 1 5 55 5 Given the information in the preceding table, use the blue points {circle symbol) to plot the demand for loanable funds. Next, use the orange pains ( square symbol) to plot the supply of loanable funds. Finally, use the black paint (cross symbol) to indicate the equilibrium in this market. Market for Loanable Funds 10 O Demand 8 6 Supply REAL INTEREST RATE 4 Equilibrium 2 0 20 40 60 80 100 QUANTITY OF LOANABLE FUNDS0n the following graph, plot the relationship between the real interest rate and net capital outflow by using the green points ( triangle symbol) to plot the points from the initial data table. Then use the black point (X symbol) to indicate the level of net capital outflow at the equilibrium real interest rate you derived in the previous graph. Net Capital Outflow 10 A 8 NCO 6 Eqm. NCO REAL INTEREST RATE 2 -20 -15 -10 -5 0 5 10 15 20 NET CAPITAL OUTFLOW (Billions of dollars)NET CAPITAL OUTFLOW (Billions of dollars) Because of the relationship between net capital outflow and net exports, the level of net capital outflow at the equilibrium real interest rate implies that the economy is experiencing Now, suppose the government is experiencing a budget deficit. This means that , which leads to loanable funds. After the budget deficit occurs, suppose the new equilibrium real interest rate is 7%. The following graph shows the demand curve in the foreign- currency exchange market. Use the green line (triangle symbol) to show the supply curve in this market before the budget deficit. Then use the purple line (diamond symbol) to show the supply curve after the budget deficit.Use the green line (triangle symbol) to show the supply curve in this market before the budget deficit. Then use the purple line (diamond symbol) to show the supply curve after the budget deficit.Market for Foreign-Currency Exchange 10 A Initial Supply 8 6 Supply with Deficit REAL EXCHANGE RATE A 2 Demand -20 -15 10 -5 0 5 10 15 20 QUANTITY OF DOLLARS (Billions)
Step by Step Solution
There are 3 Steps involved in it

Get step-by-step solutions from verified subject matter experts