

Question: Complete the table for the given function and then plot the resulting graph y 5 sin x X A 3 4 T 2 R4 0

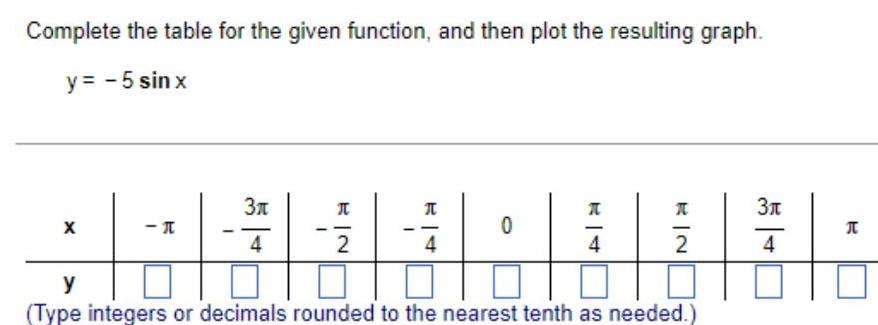
Complete the table for the given function and then plot the resulting graph y 5 sin x X A 3 4 T 2 R4 0 R4 RIN A 2 y Type integers or decimals rounded to the nearest tenth as needed 3x 4
Step by Step Solution
There are 3 Steps involved in it
1 Expert Approved Answer
Step: 1 Unlock

Question Has Been Solved by an Expert!
Get step-by-step solutions from verified subject matter experts
Step: 2 Unlock
Step: 3 Unlock