

Question: Complete the try it yourself questions 2-6 EXAMPLE 3 Interpreting the Central Limit Theorem The heights of fully grown white oak trees are normally distributed,
Complete the try it yourself questions 2-6
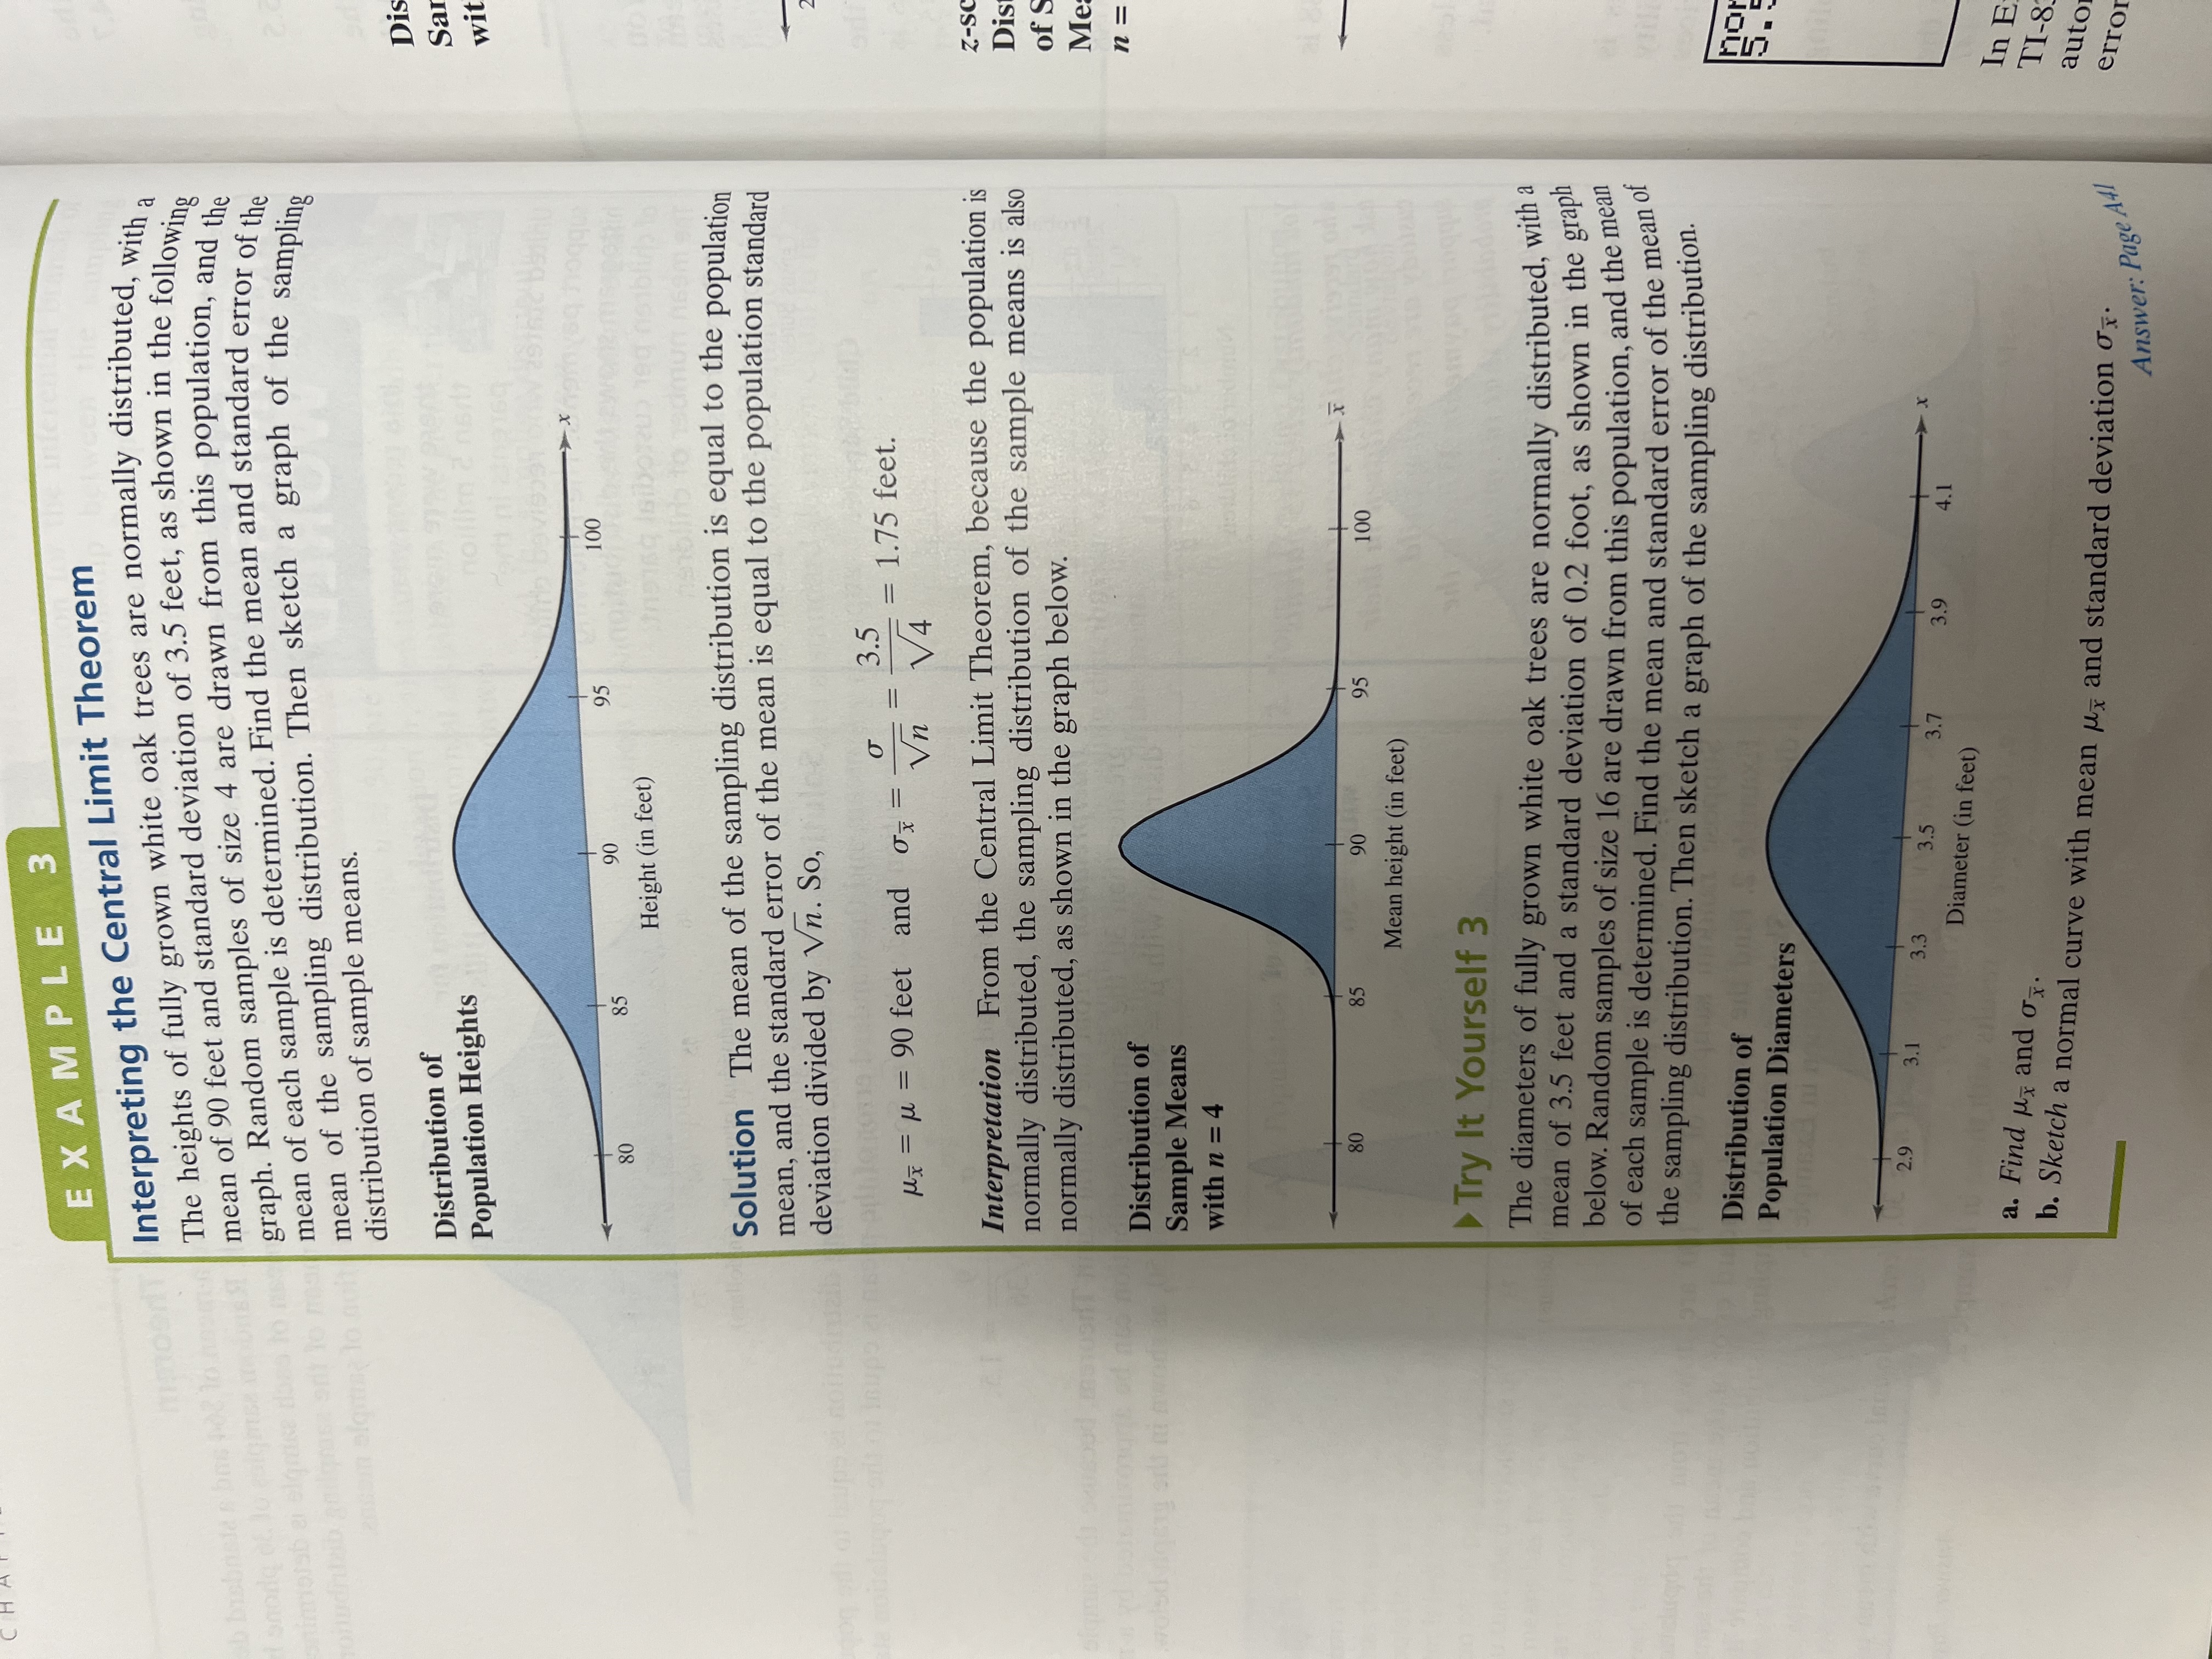
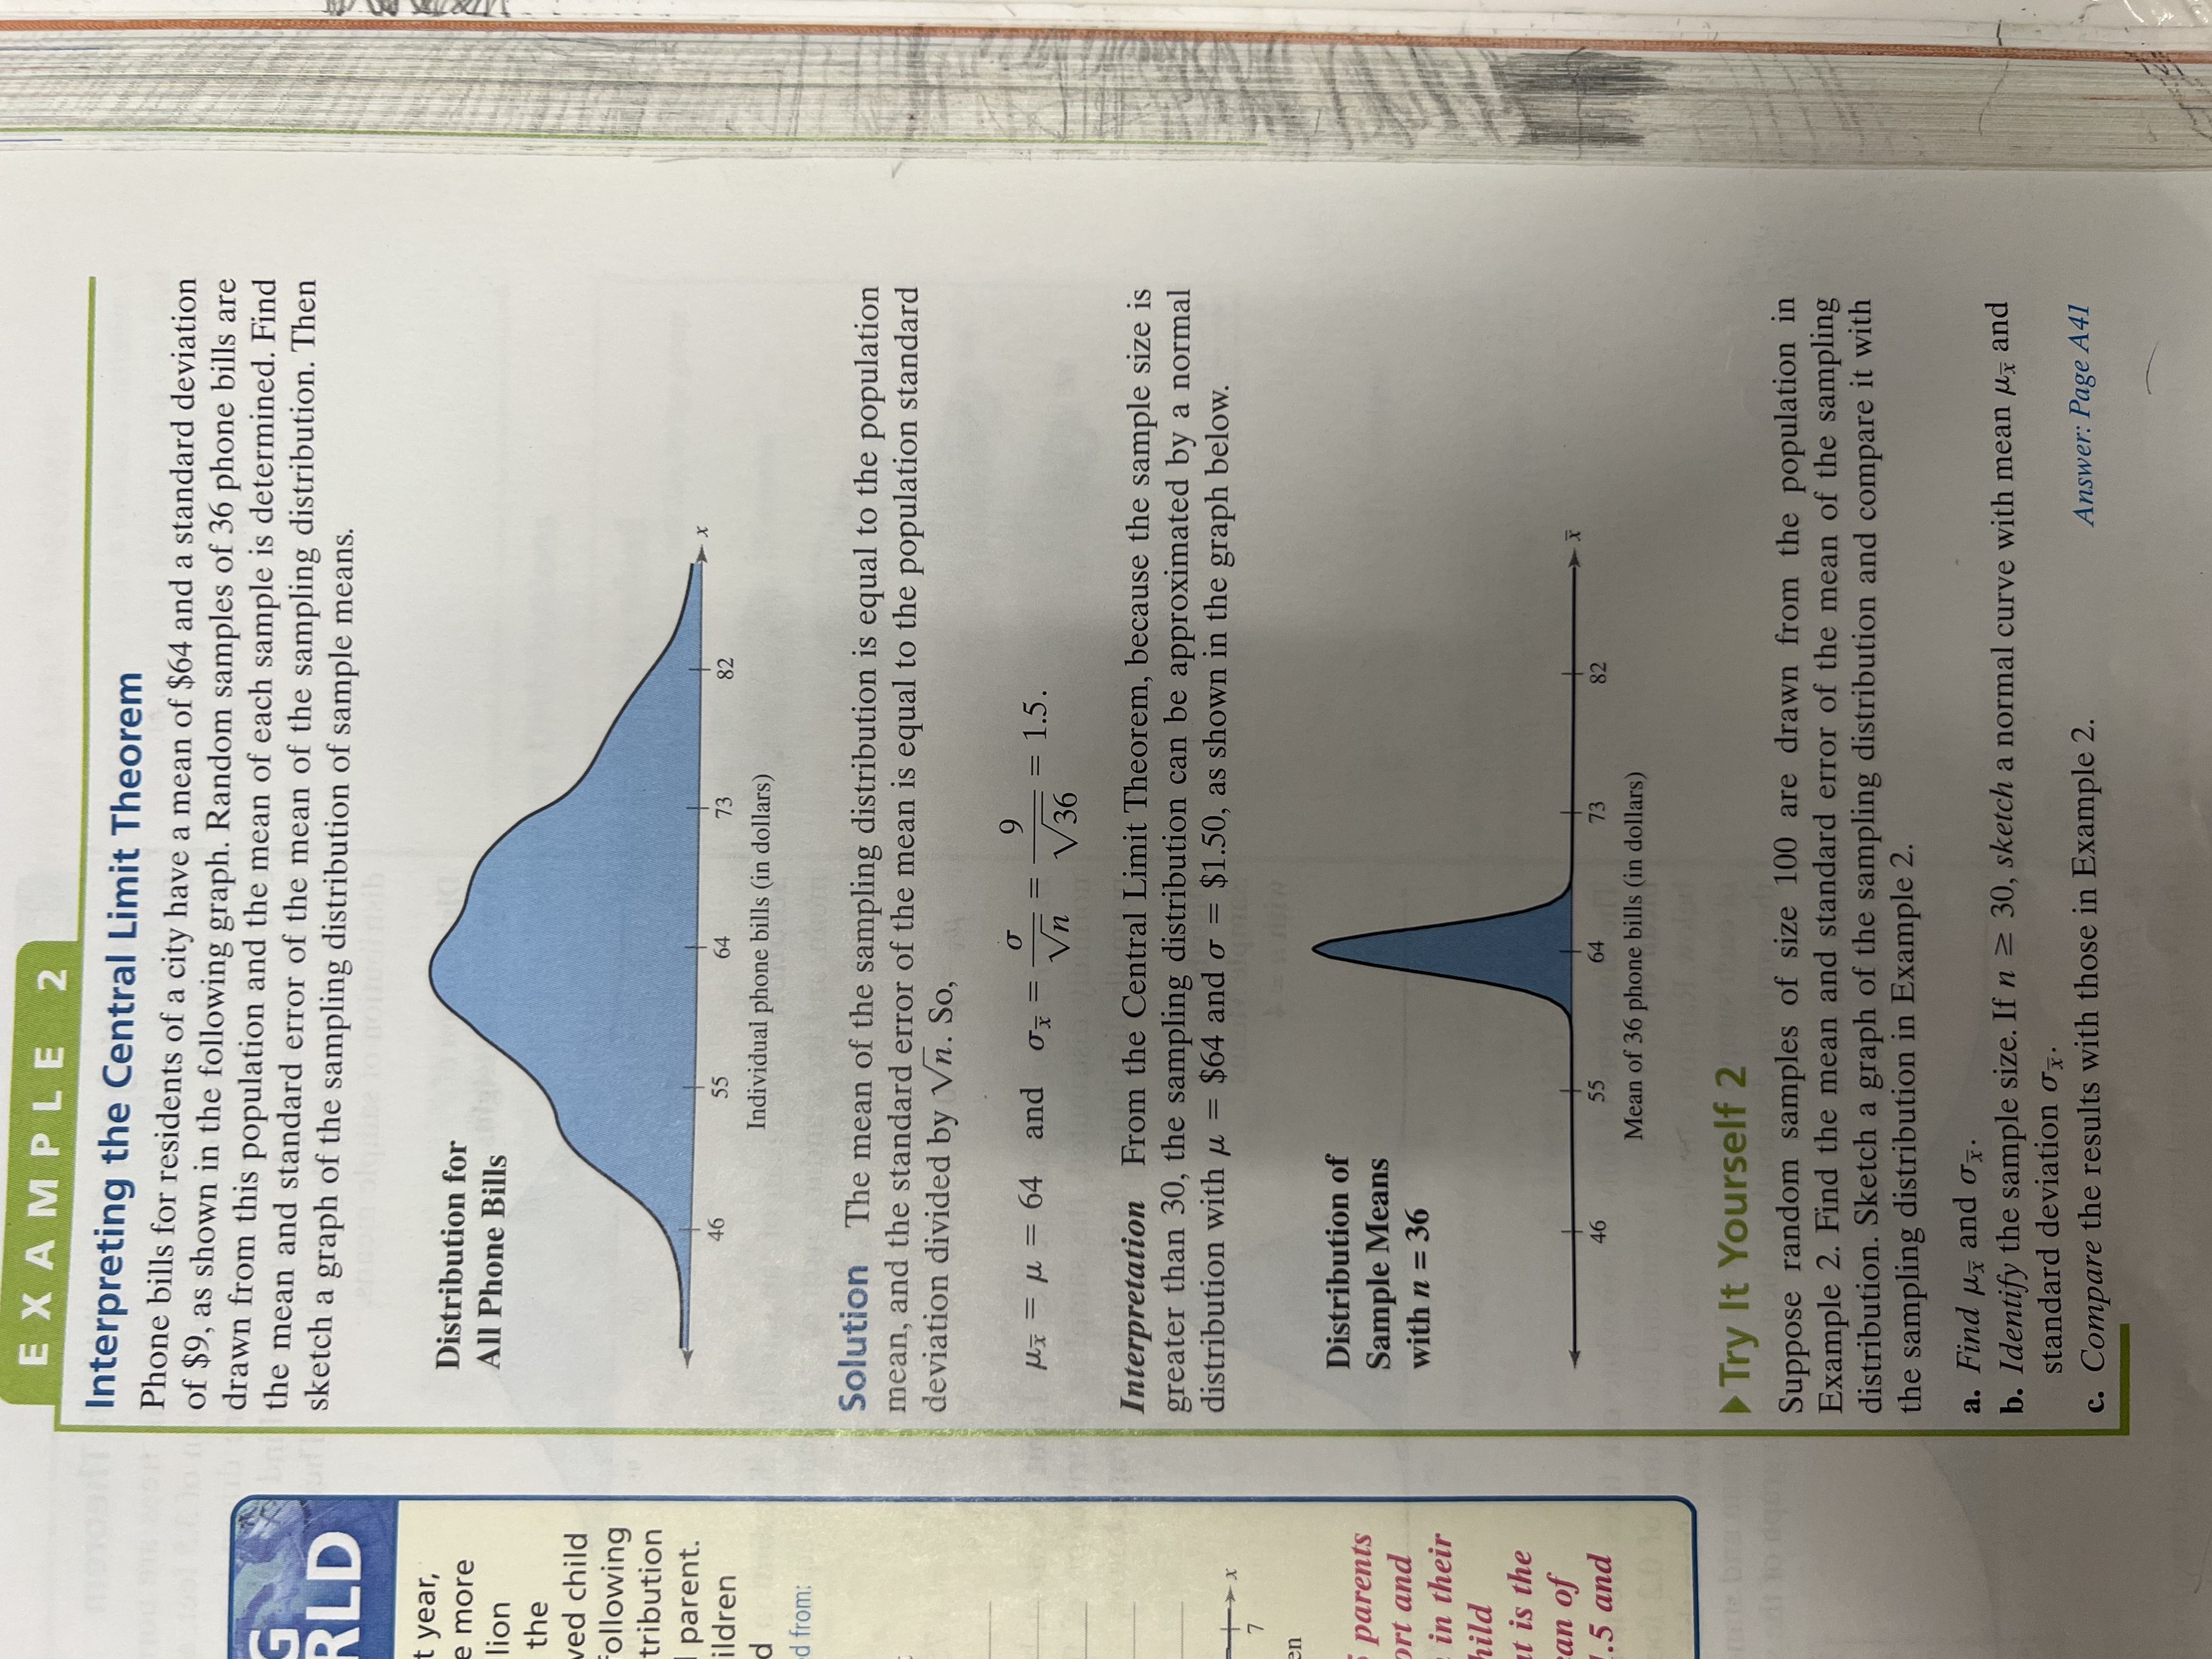
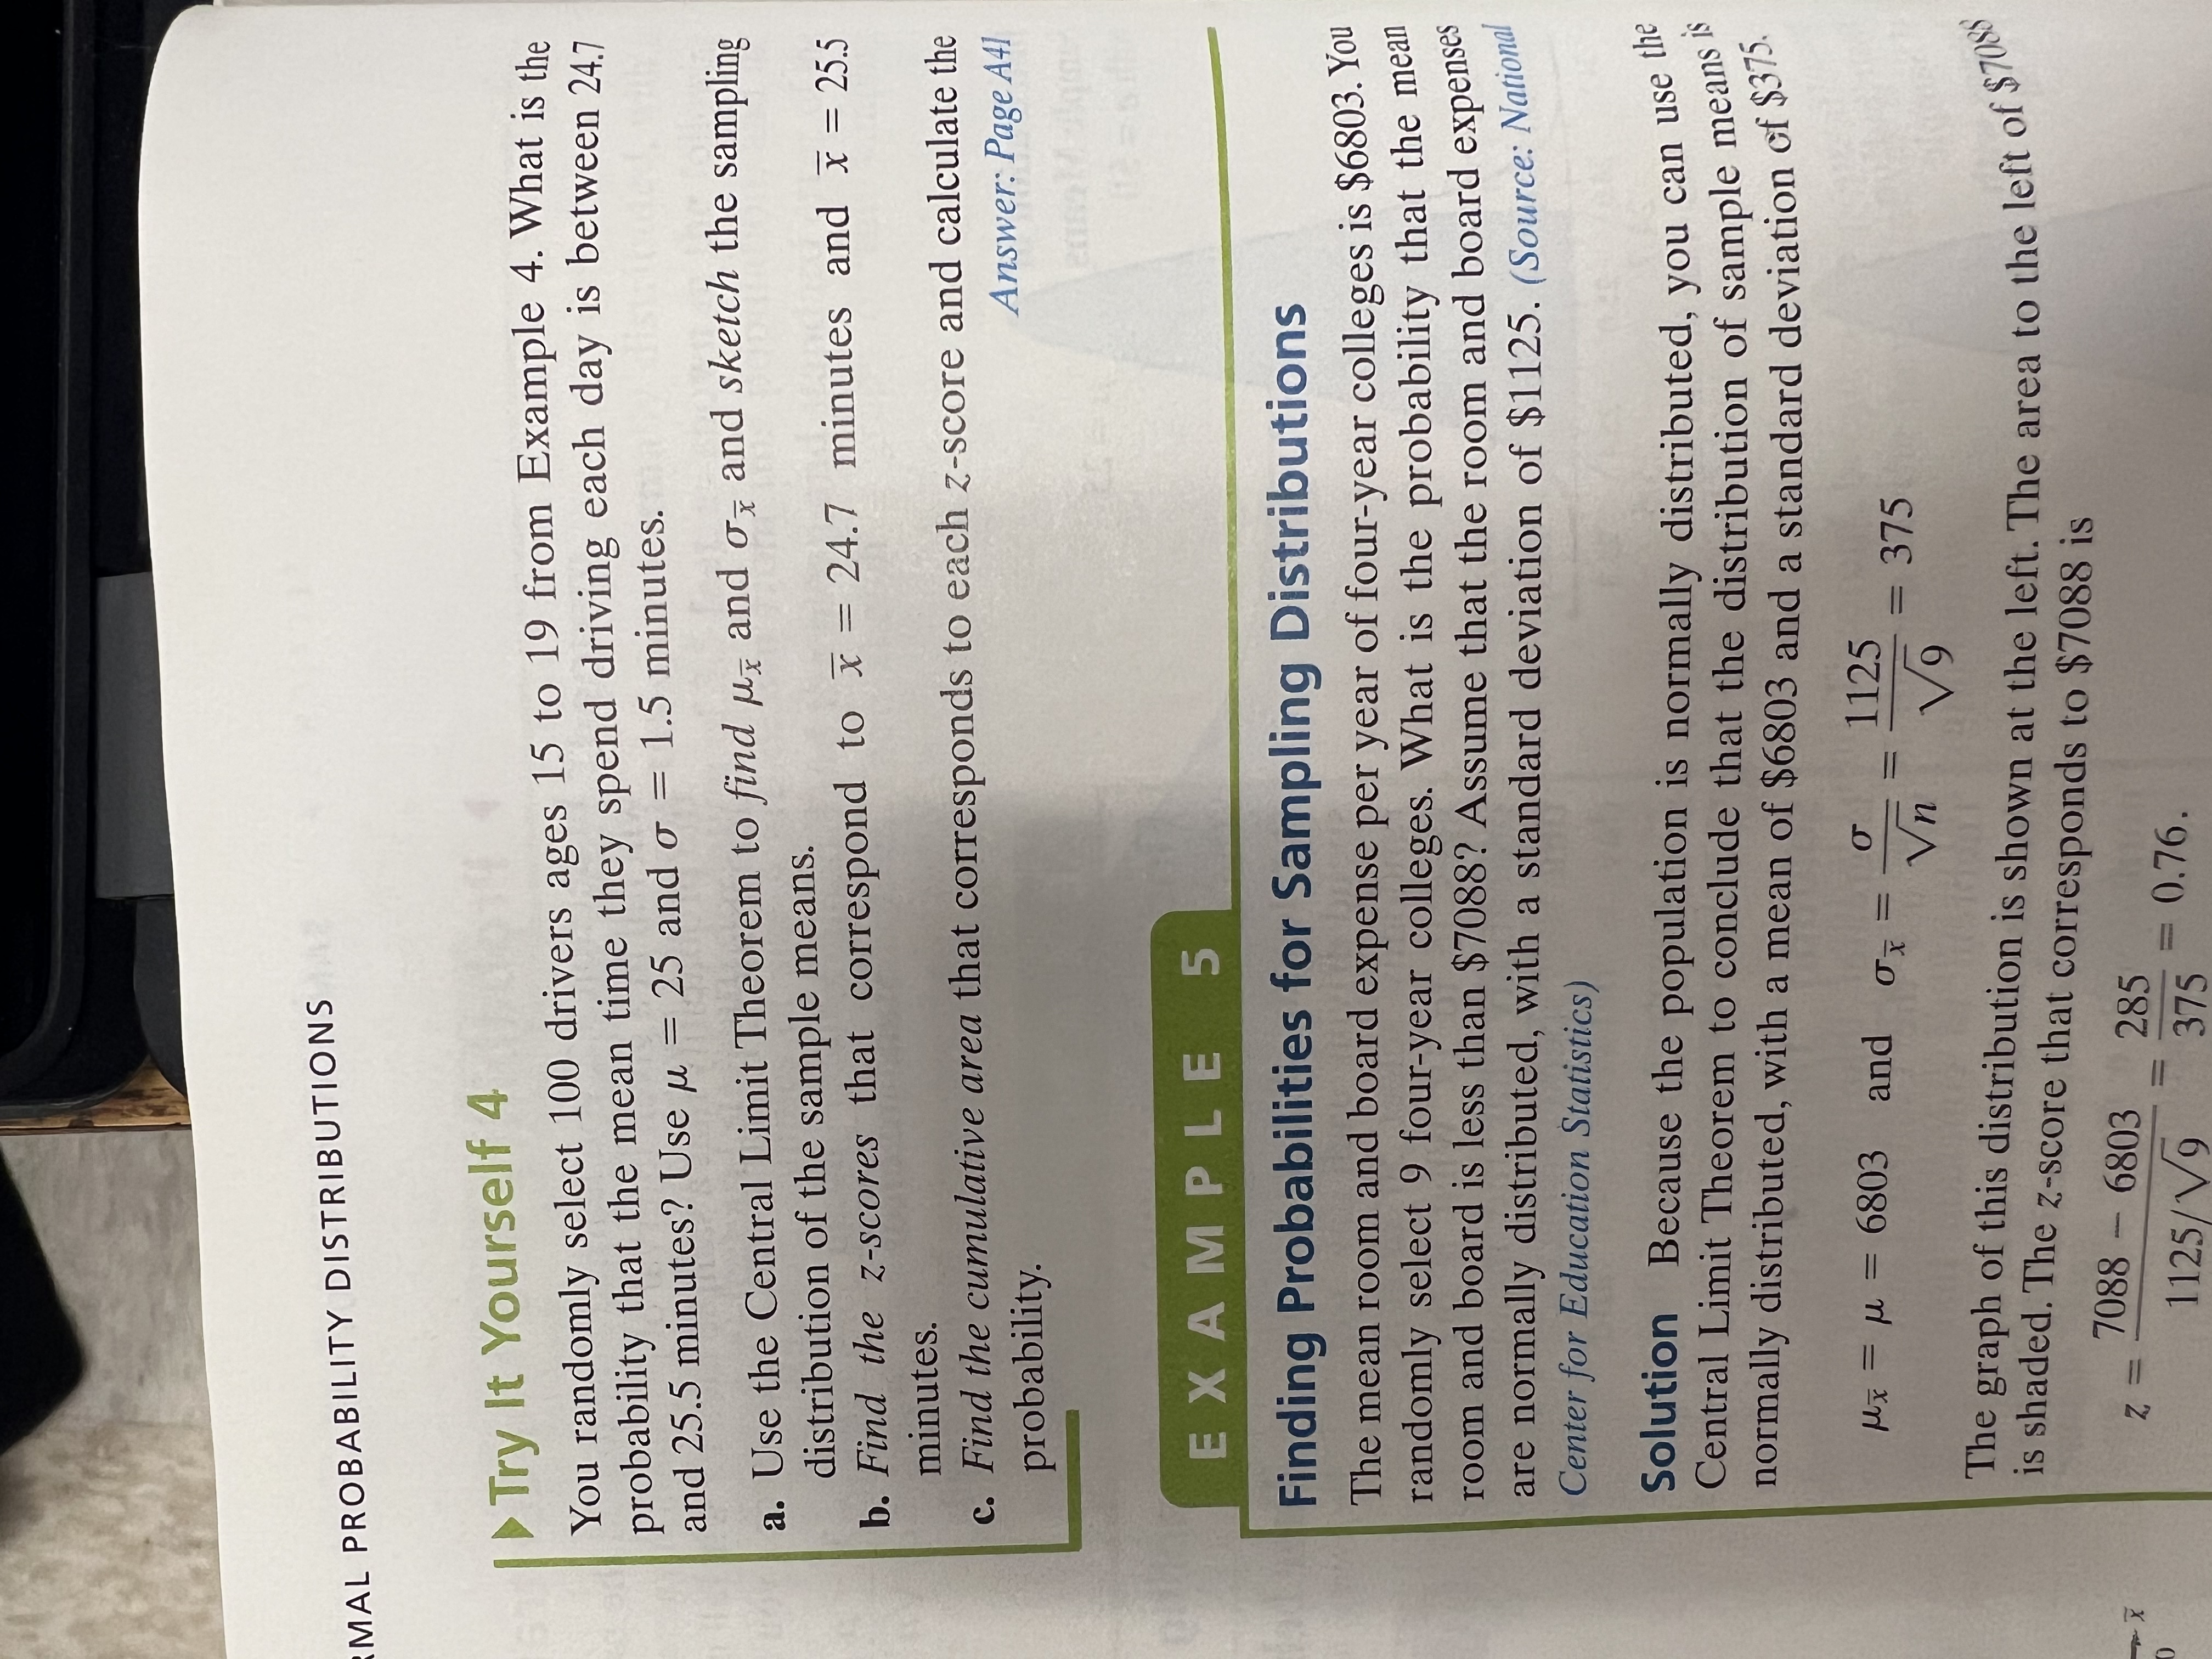
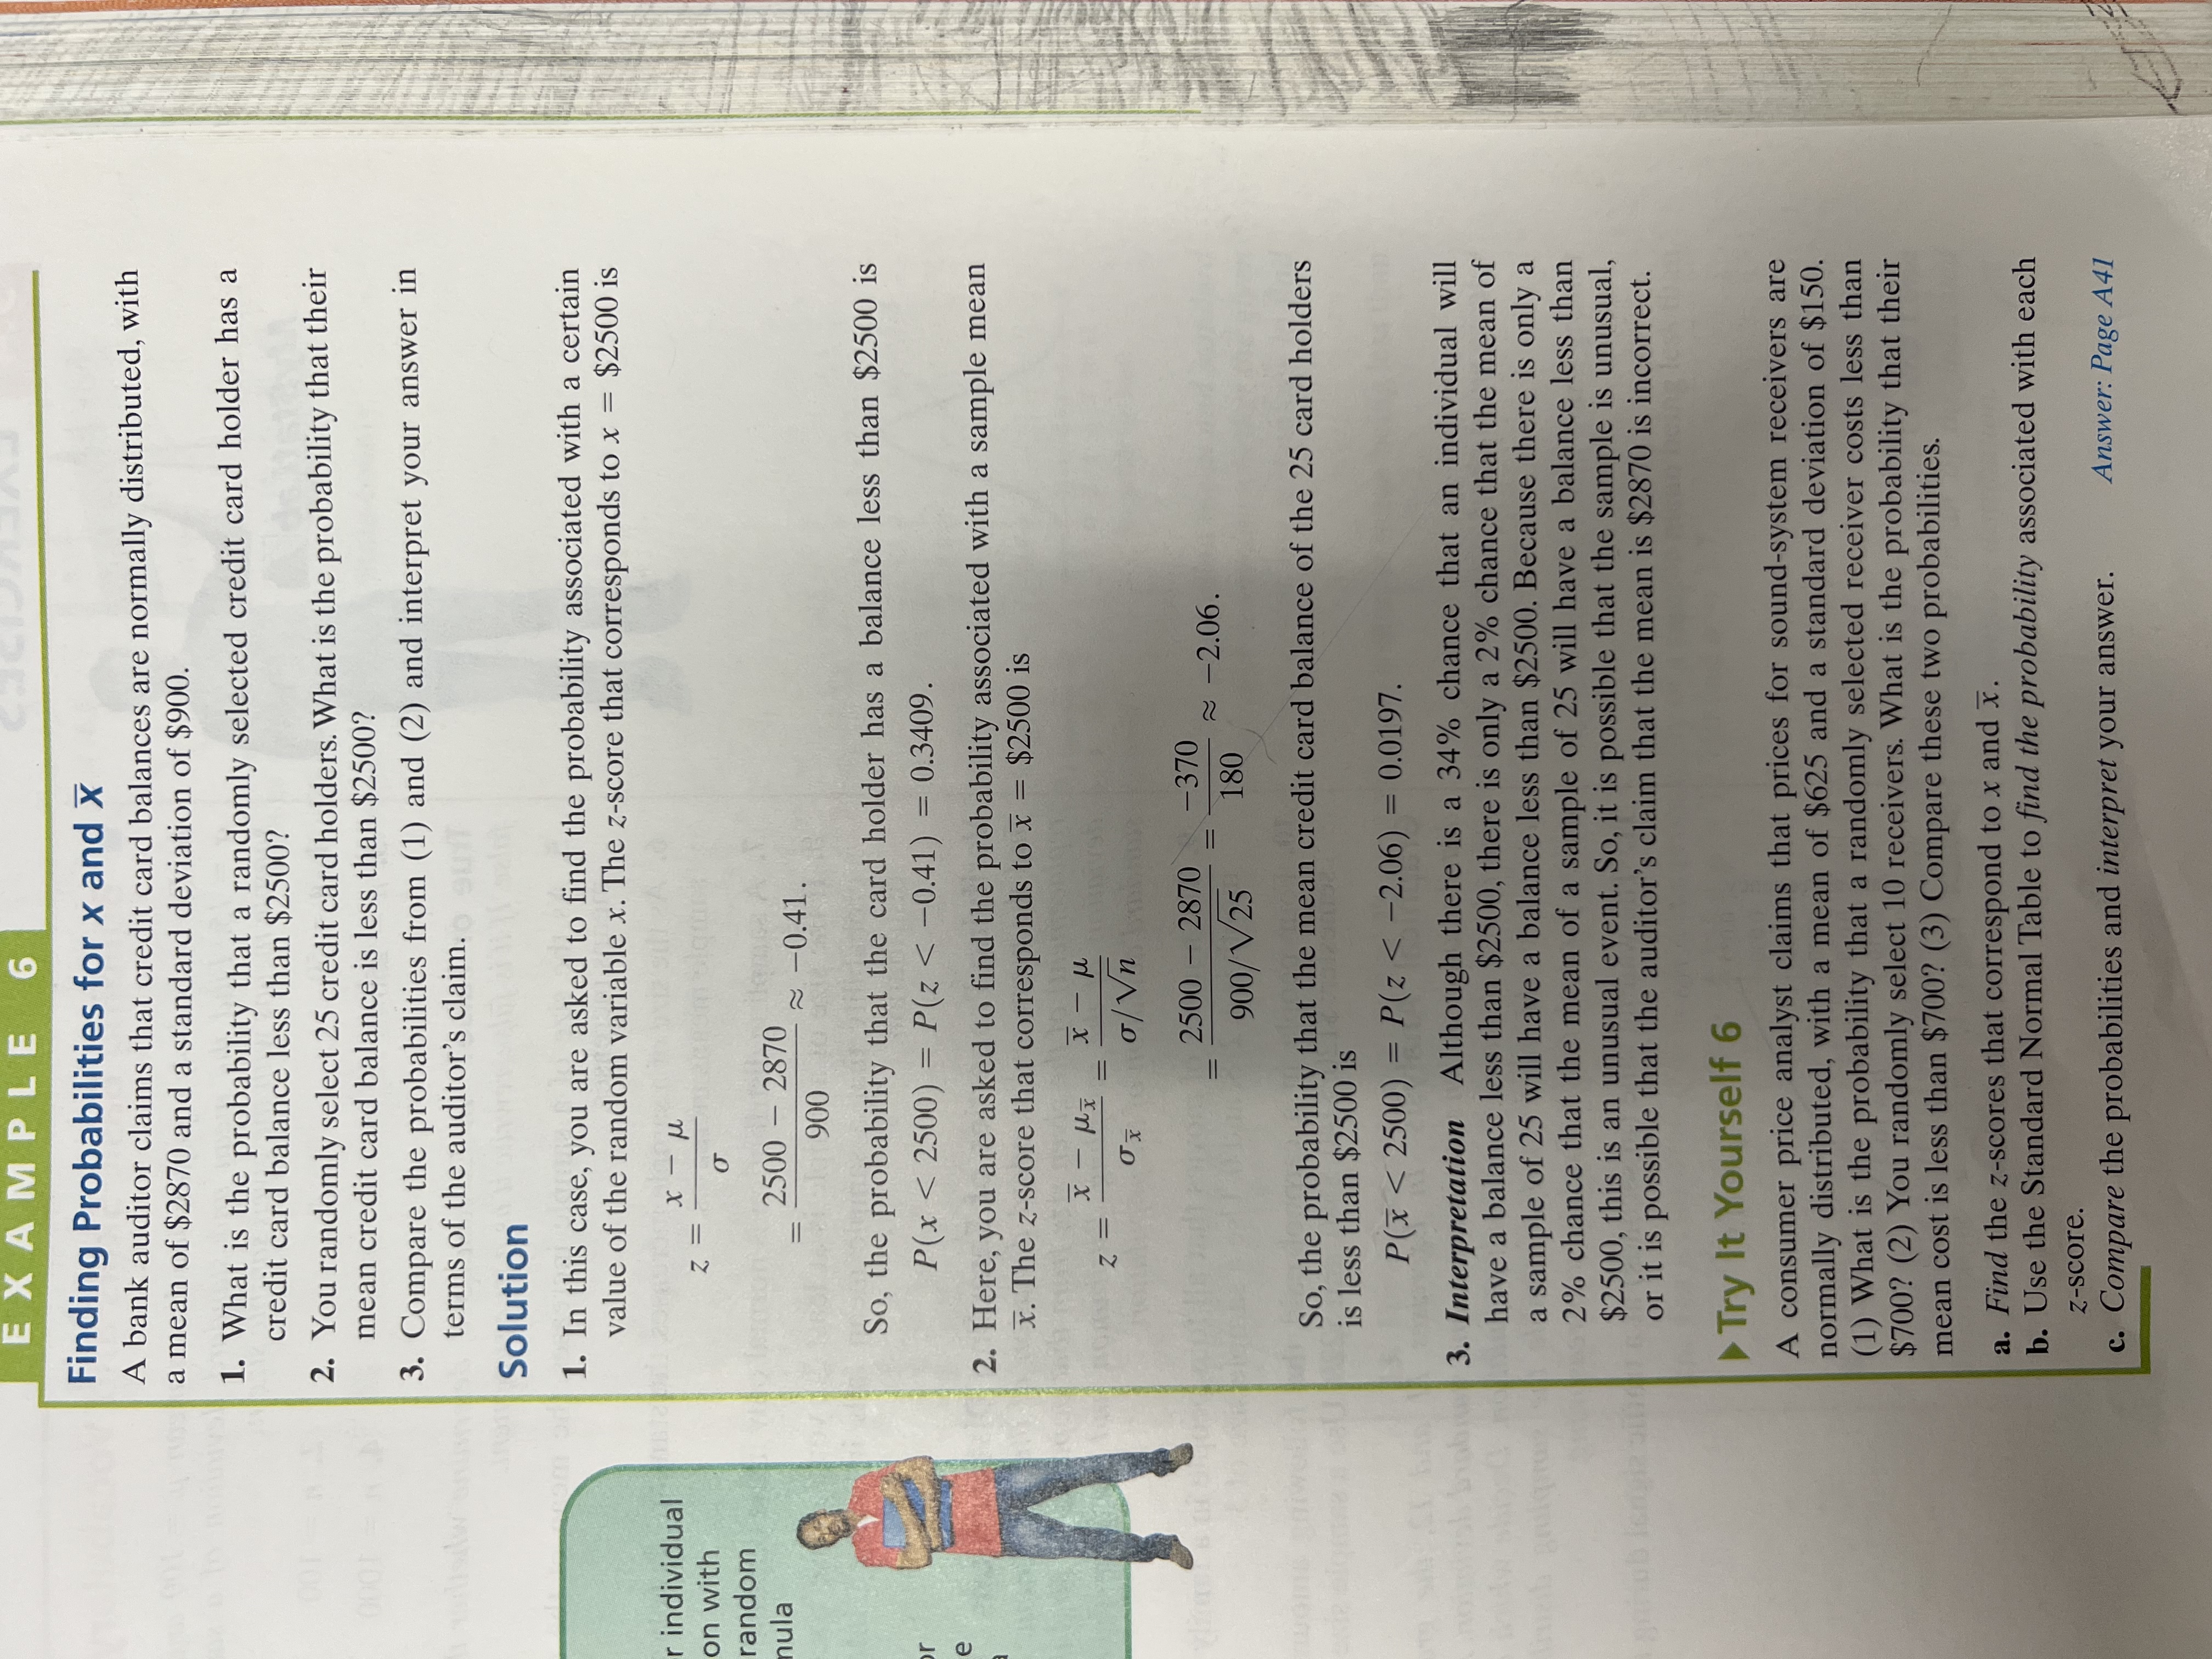
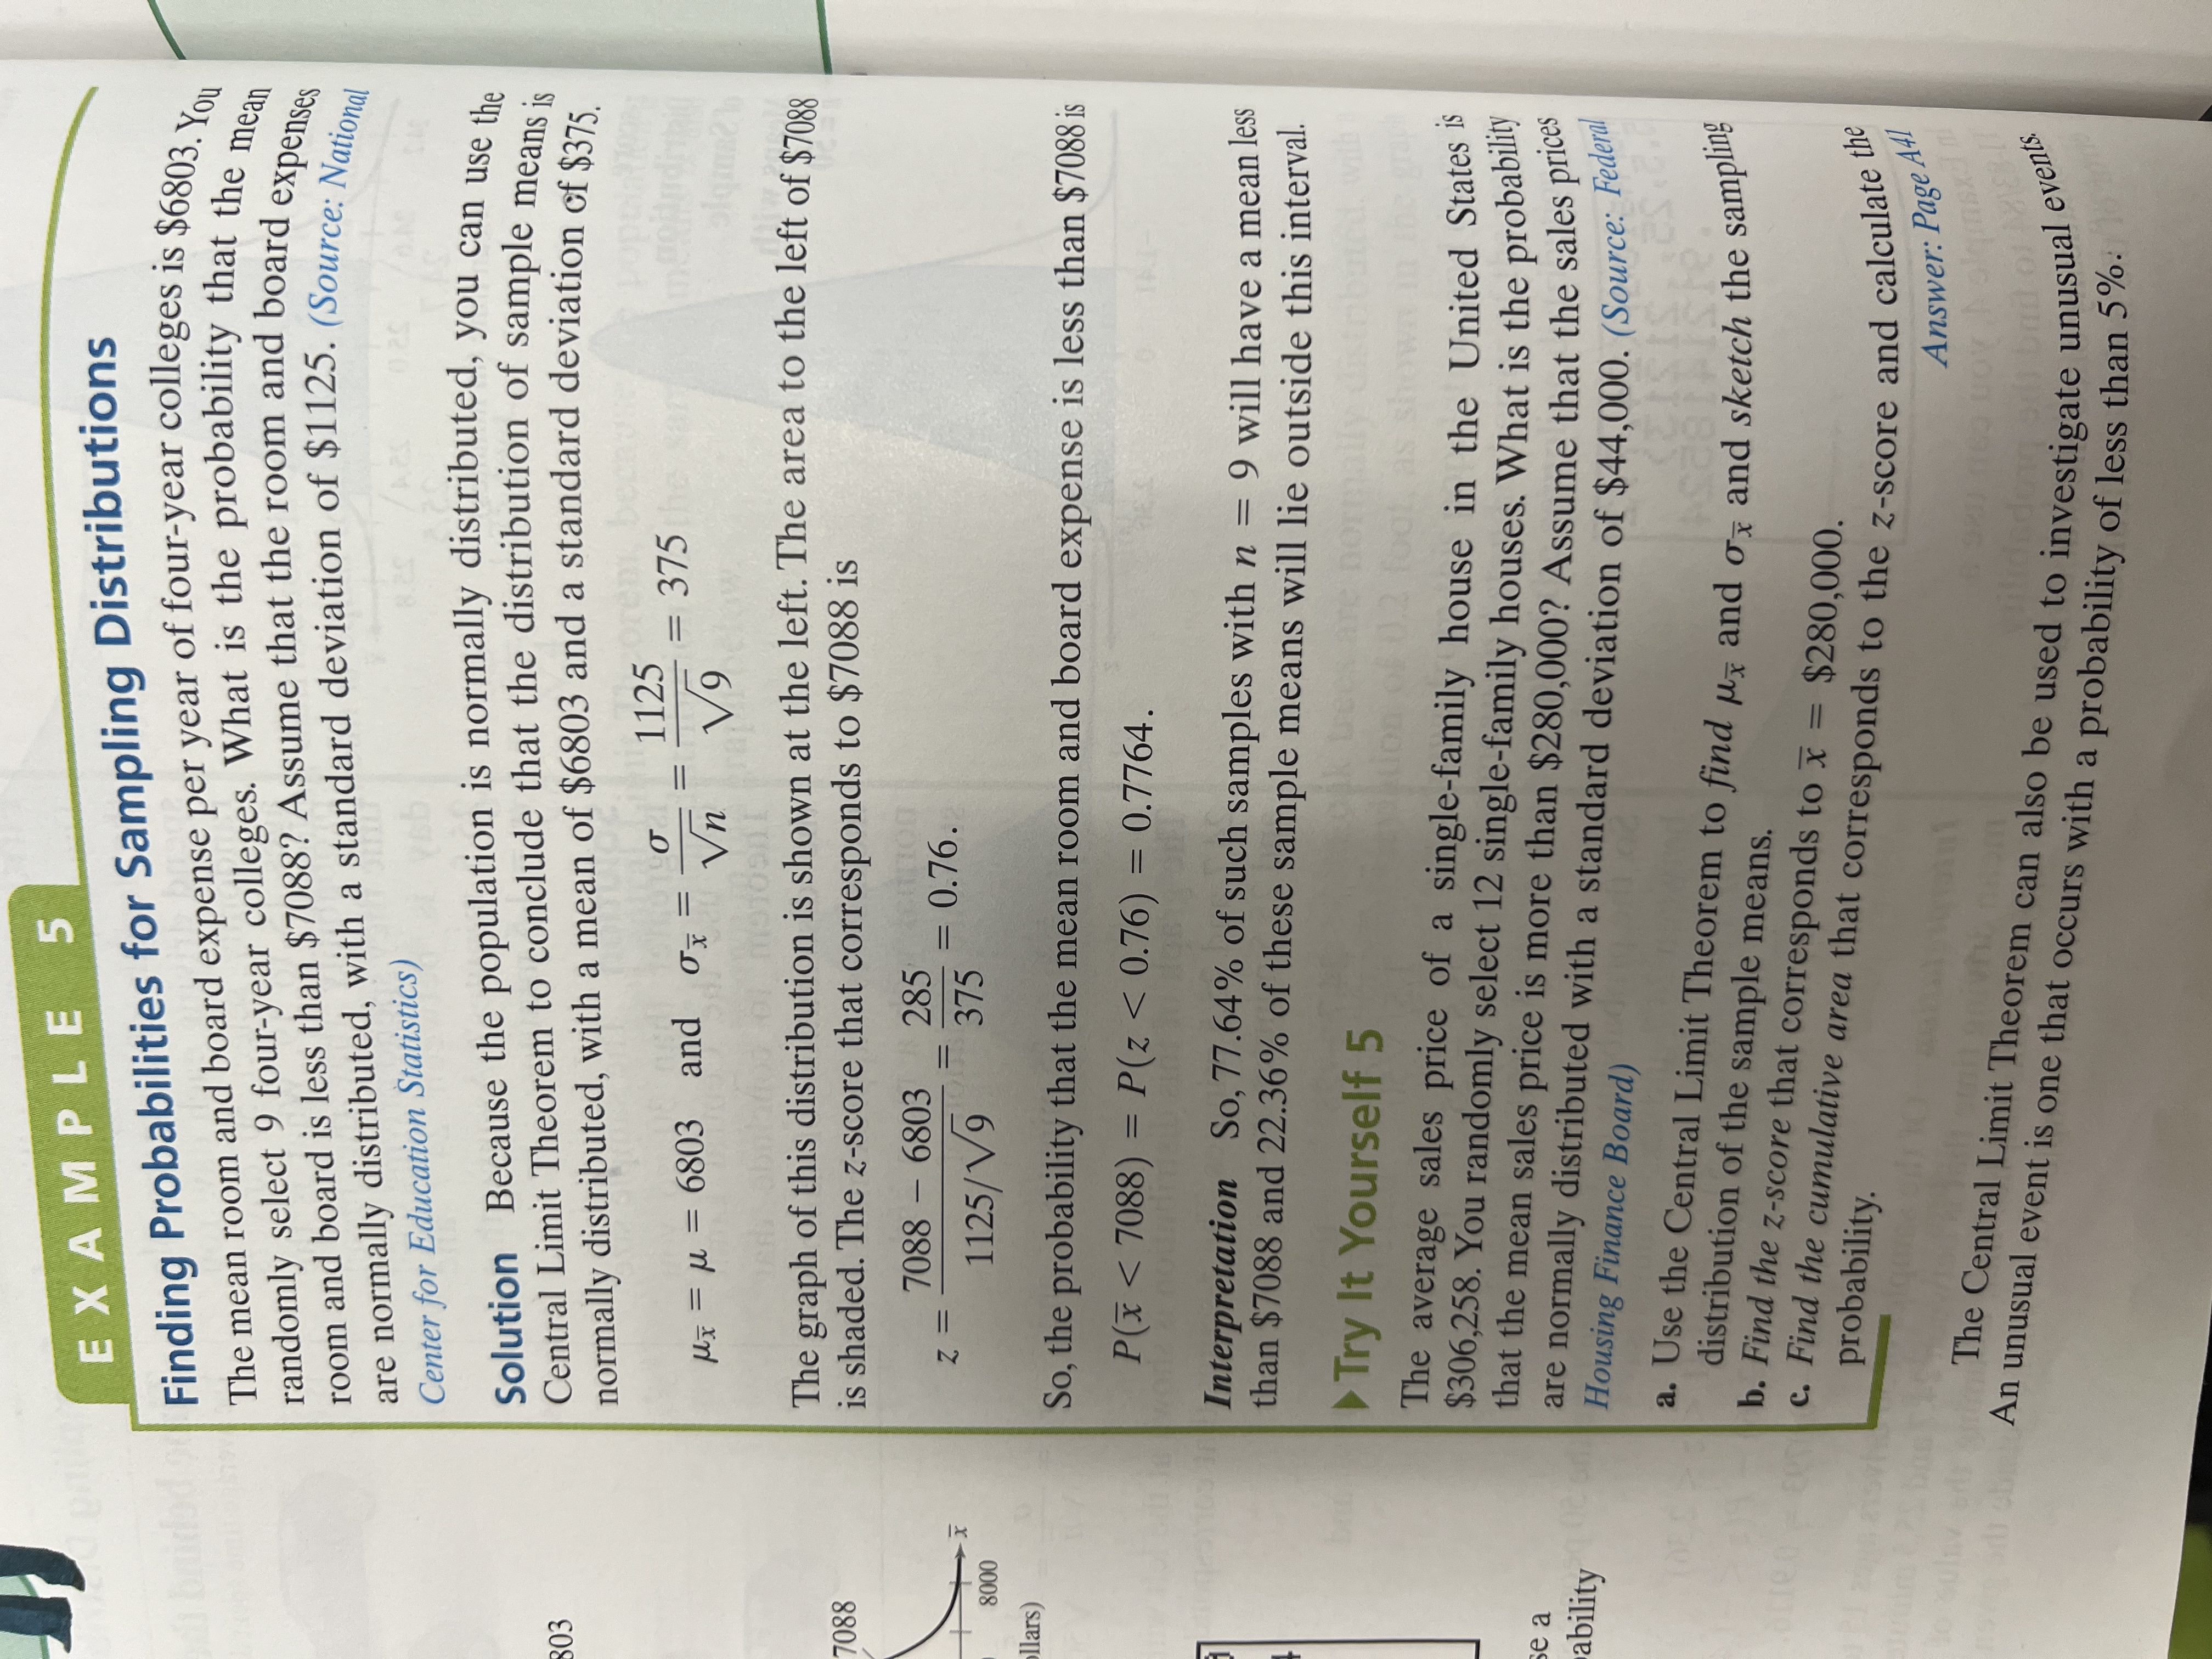
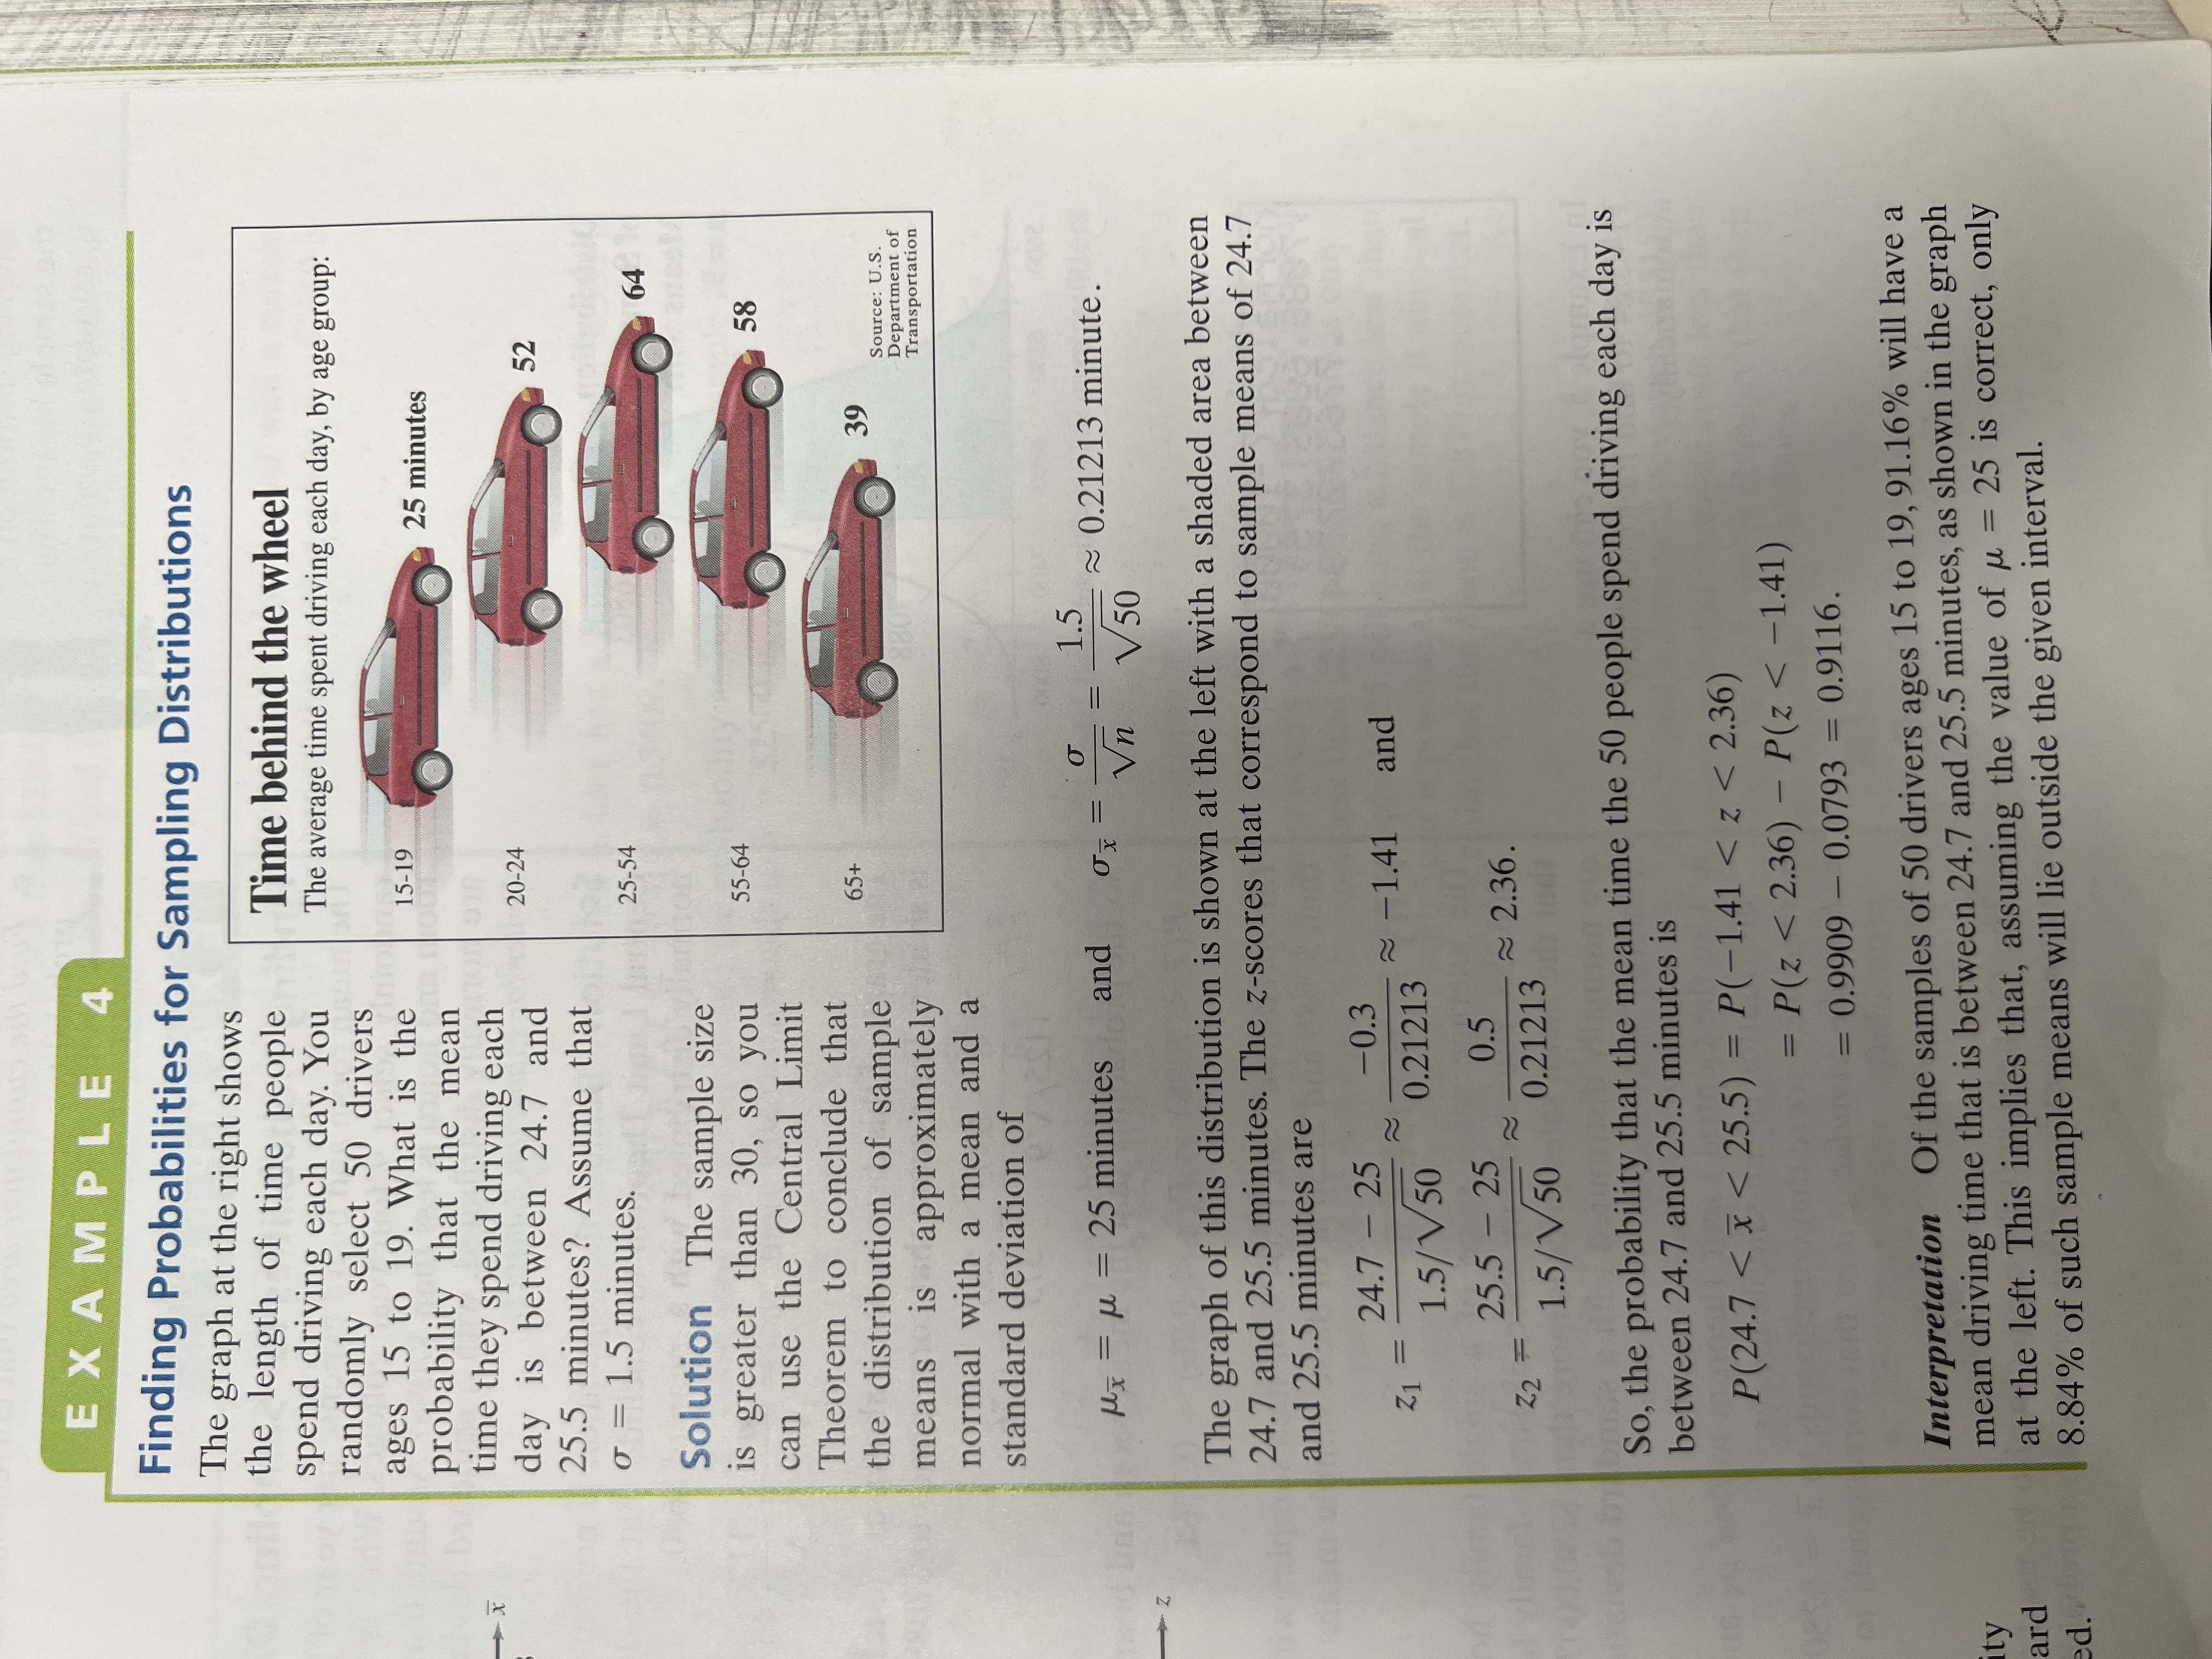
EXAMPLE 3 Interpreting the Central Limit Theorem The heights of fully grown white oak trees are normally distributed, with a mean of 90 feet and standard deviation of 3.5 feet, as shown in the following graph. Random samples of size 4 are drawn from this population, and the mean of each sample is determined. Find the mean and standard error of the mean of the sampling distribution. Then sketch a graph of the sampling distribution of sample means. Dis Distribution of Sar Population Heights wit 95 100 80 85 90 Height (in feet) siboreun he Solution The mean of the sampling distribution is equal to the population mean, and the standard error of the mean is equal to the population standard deviation divided by Vn. So, 3.5 My = M = 90 feet and ox = = 1.75 feet. Vn Interpretation From the Central Limit Theorem, because the population is Z-S normally distributed, the sampling distribution of the sample means is also Dis normally distributed, as shown in the graph below. of Me Distribution of n = Sample Means with n = 4 80 85 90 95 100 Mean height (in feet) Try It Yourself 3 The diameters of fully grown white oak trees are normally distributed, with a mean of 3.5 feet and a standard deviation of 0.2 foot, as shown in the graph below. Random samples of size 16 are drawn from this population, and the mean of each sample is determined. Find the mean and standard error of the mean of the sampling distribution. Then sketch a graph of the sampling distribution. Distribution of Population Diameters 5. 2.9 3 .1 3.3 3.5 3.7 3.9 4.1 Diameter (in feet) a. Find MY and ox. In E TI-8 b. Sketch a normal curve with mean My and standard deviation of. auto Answer: Page A41 errorEXAMPLE 2 Interpreting the Central Limit Theorem Phone bills for residents of a city have a mean of $64 and a standard deviation of $9, as shown in the following graph. Random samples of 36 phone bills are G drawn from this population and the mean of each sample is determined. Find the mean and standard error of the mean of the sampling distribution. Then LD sketch a graph of the sampling distribution of sample means. year, e more Distribution for lion All Phone Bills the ved child ollowing tribution parent. ildren 55 64 73 82 Individual phone bills (in dollars) d from: Solution The mean of the sampling distribution is equal to the population mean, and the standard error of the mean is equal to the population standard deviation divided by Vn. So, MX = M = 64 and of = 9 Vn V 36 = 1.5. Interpretation From the Central Limit Theorem, because the sample size is greater than 30, the sampling distribution can be approximated by a normal distribution with u = $64 and o = $1.50, as shown in the graph below. en Distribution of parents Sample Means ort and with n = 36 in their hild it is the an of .5 and 46 55 64 73 82 Mean of 36 phone bills (in dollars) Try It Yourself 2 Suppose random samples of size 100 are drawn from the population in Example 2. Find the mean and standard error of the mean of the sampling distribution. Sketch a graph of the sampling distribution and compare it with the sampling distribution in Example 2. a. Find ux and ox. b. Identify the sample size. If n 2 30, sketch a normal curve with mean My and standard deviation ox. c. Compare the results with those in Example 2. Answer: Page A41MAL PROBABILITY DISTRIBUTIONS Try It Yourself 4 You randomly select 100 drivers ages 15 to 19 from Example 4. What is the probability that the mean time they spend driving each day is between 24.7 and 25.5 minutes? Use u = 25 and o = 1.5 minutes. a. Use the Central Limit Theorem to find ux and ox and sketch the sampling distribution of the sample means. b. Find the z-scores that correspond to x = 24.7 minutes and x = 25.5 minutes. c. Find the cumulative area that corresponds to each z-score and calculate the probability. Answer: Page A41 EXAMPLE Finding Probabilities for Sampling Distributions The mean room and board expense per year of four-year colleges is $6803. You randomly select 9 four-year colleges. What is the probability that the mean room and board is less than $7088? Assume that the room and board expenses are normally distributed, with a standard deviation of $1125. (Source: National Center for Education Statistics) Solution Because the population is normally distributed, you can use the Central Limit Theorem to conclude that the distribution of sample means normally distributed, with a mean of $6803 and a standard deviation of $375 Mx = M = 6803 and ox 1125 Vn Vo = 375 The graph of this distribution is shown at the left. The area to the left of $708 is shaded. The z-score that corresponds to $7088 is Z = 7088 - 6803 285 1125/ V9 375 = 0.76EXAMPLE 6 Finding Probabilities for x and x A bank auditor claims that credit card balances are normally distributed, with a mean of $2870 and a standard deviation of $900. 1. What is the probability that a randomly selected credit card holder has a credit card balance less than $2500? 2. You randomly select 25 credit card holders. What is the probability that their mean credit card balance is less than $2500? 3. Compare the probabilities from (1) and (2) and interpret your answer in terms of the auditor's claim. Solution 1. In this case, you are asked to find the probability associated with a certain value of the random variable x. The z-score that corresponds to x = $2500 is r individual * - M on with Z random ula 2500 - 2870 900 ~ -0.41. So, the probability that the card holder has a balance less than $2500 is P(x
Step by Step Solution
There are 3 Steps involved in it

Get step-by-step solutions from verified subject matter experts