

Question: Complete the Variance column What was the calculation you used? 2) What conclusions can you draw from the Variance column when comparing hospitals? 3)
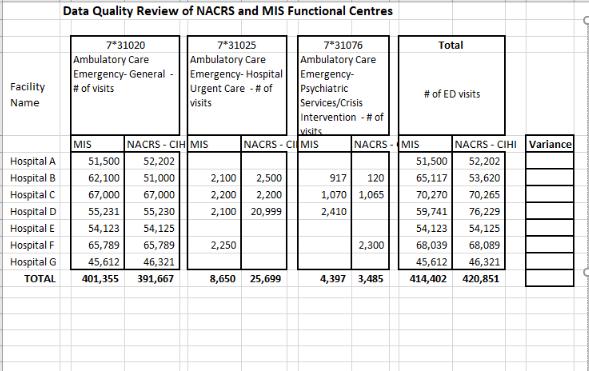
Complete the Variance column What was the calculation you used? 2) What conclusions can you draw from the Variance column when comparing hospitals? 3) Which of the hospitals is doing a better job of capturing the Emergency visits? 4) What Data Quality issues can you identify in the above? Include an example for each DQ issue you found Facility Name Hospital A Hospital B Hospital C Hospital D Hospital E Hospital F Hospital G TOTAL Data Quality Review of NACRS and MIS Functional Centres 7*31025 Ambulatory Care Emergency- Hospital Urgent Care # of visits 7*31020 Ambulatory Care Emergency-General # of visits MIS NACRS - CIH MIS 52,202 51,000 51,500 62,100 67,000 55,231 54,123 65,789 45,612 46,321 401,355 391,667 67,000 55,230 54,125 65,789 2,100 2,500 2,200 2,200 2,100 20,999 2,250 visits NACRS-CI MIS 7*31076 Ambulatory Care Emergency- Psychiatric Services/Crisis Intervention - # of 8,650 25,699 NACRS-MIS 917 120 1,070 1,065 2,410 2,300 4,397 3,485 Total # of ED visits NACRS-CIHI Variance 52,202 53,620 70,265 59,741 76,229 54,123 54,125 68,039 68,089 45,612 46,321 414,402 420,851 51,500 65,117 70,270
Step by Step Solution
3.47 Rating (157 Votes )
There are 3 Steps involved in it
To complete the Variance column you would subtract the NACRS value from the MIS value for each hospital Variance MIS NACRS Heres the completed Varianc... View full answer

Get step-by-step solutions from verified subject matter experts