

Question: Complete the worksheet. Instructions for submitting your assignment are a t the end o f this document. Consider the parametric equations x = t 2
Complete the worksheet. Instructions for submitting your assignment are the end this document.
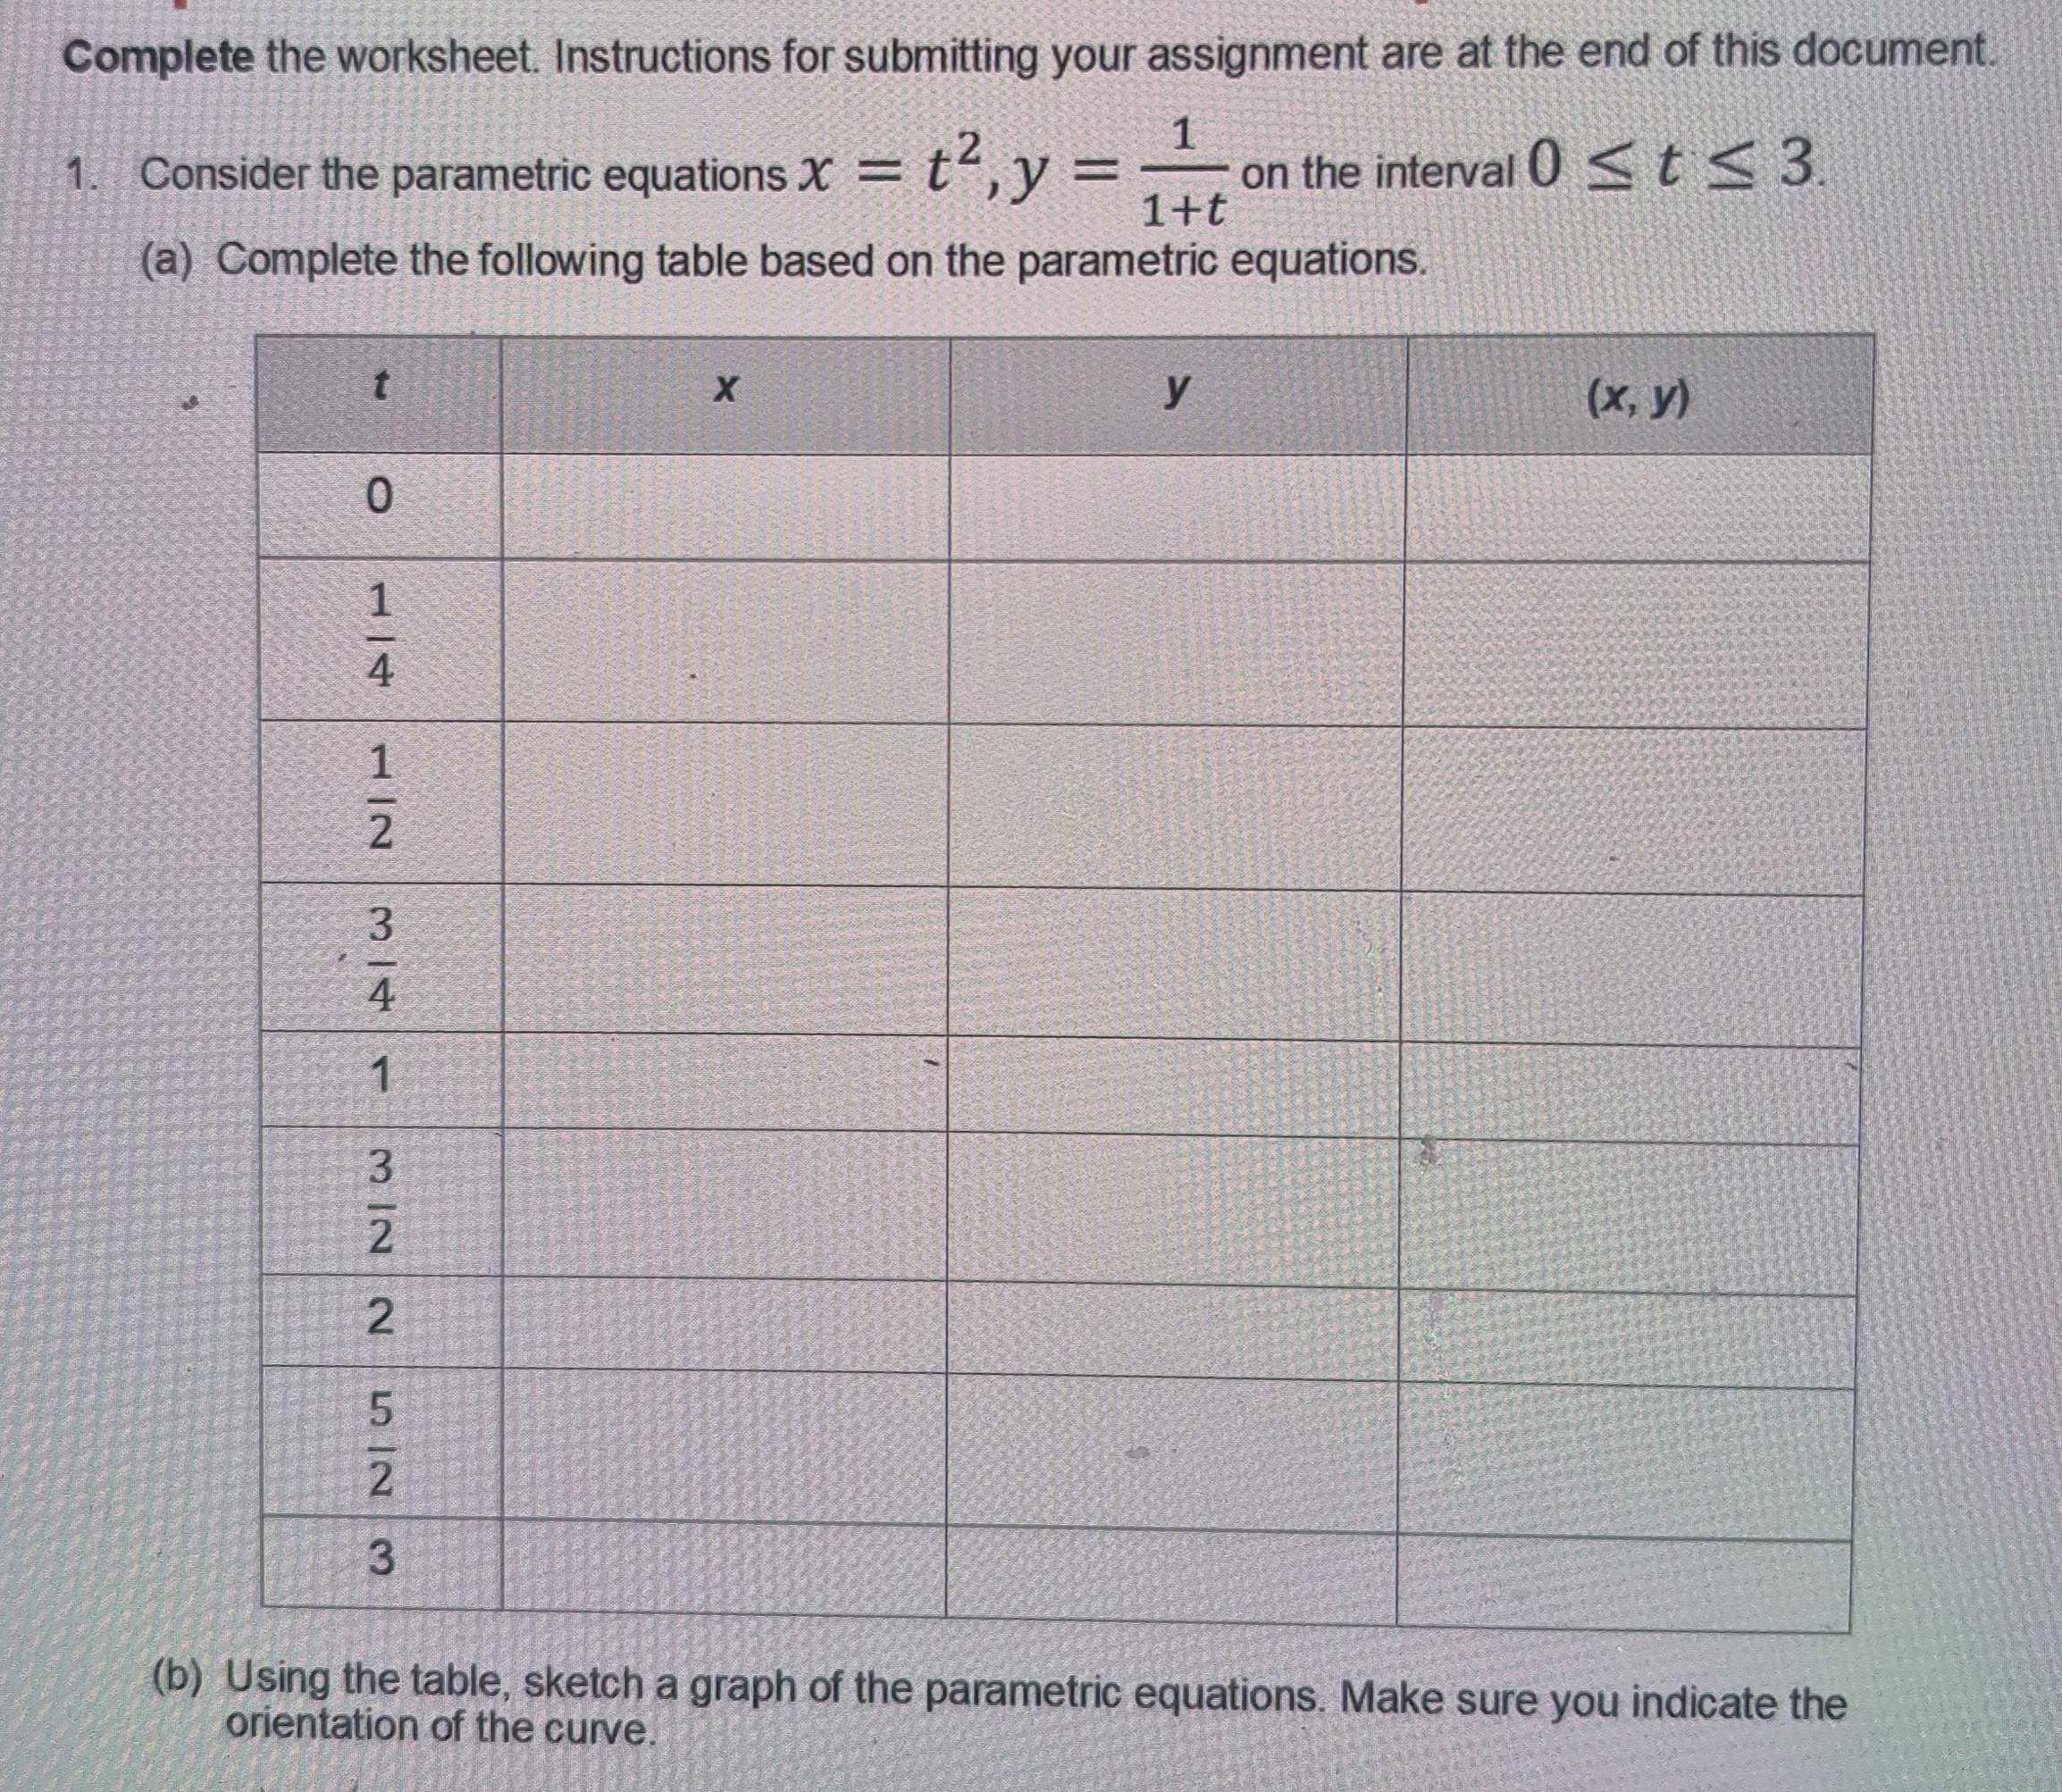
Consider the parametric equations the interval
Complete the following table based the parametric equations.
Using the table, sketch a graph the parametric equations. Make sure you indicate the
orientation the curve. Consider the polar curve the interval
Complete the following table based the polar curve. Note: and represent the
coordinates the polar point Using the table, sketch a graph the polar curve. Using a graphic utility, sketch a graph the polar curve the
interval One graphing utility you could use Desmos. the Desmos site, click the
three lines the top left the page and choose one the Polar options get started.
For help with Desmos, click the Help icon and watch the video tutorials.
Step by Step Solution
There are 3 Steps involved in it
1 Expert Approved Answer
Step: 1 Unlock

Question Has Been Solved by an Expert!
Get step-by-step solutions from verified subject matter experts
Step: 2 Unlock
Step: 3 Unlock